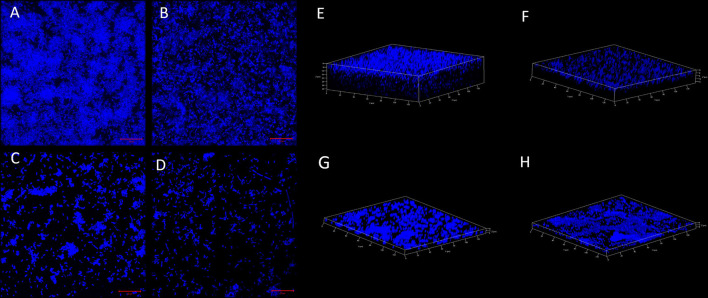
Figure 5.
(A–D) Biofilm cell adherence assay through CSLM. (A,B) show control EcN and K12 cells while the (C,D) show csgD-KD cells of EcN and K12. The control cells (A,B) robust biofilm and aggregated cells have high EPS content, while the csgD-KD cells show a reduction in the EPS contents, as well, as the cells seem to be dispersed. The images were taken on a 20-μm scale. (E–H) 3D confocal images are showing biofilm thickness. (E,F) show control EcN and K12 cells, while G,H show csgD-KD cells of EcN and K12. The csgD-KD cells show a reduction in the biofilm thickness as compared to the control cells. In this figure and 6 images were taken at a 20-μm scale and on 63X magnification.

