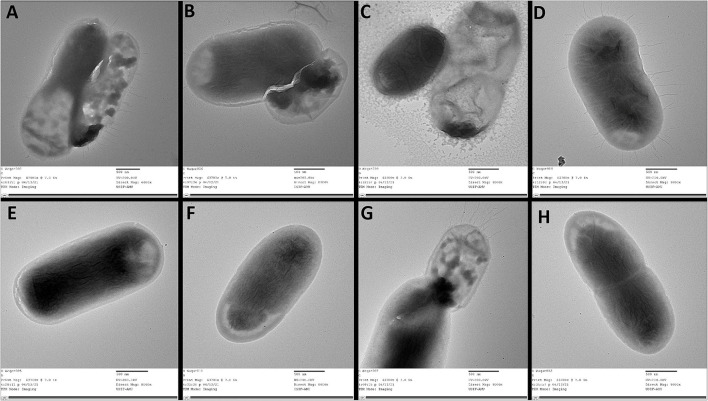
Figure 6.
TEM images of csgD-KD cells of EcN and K12. (A–D) shows control of TEA, TKA, TEB, and TKB, respectively, while (E–H) represents the csgD-KD cells of TEA, TKA, TEB, and TKB. The control cells show a large number of fimbriae, curli amyloid fibers, and other cell surface extremities, while the csgD-KD cells show no fimbriae on their cell surface. All images were taken on a 500-nm scale.

