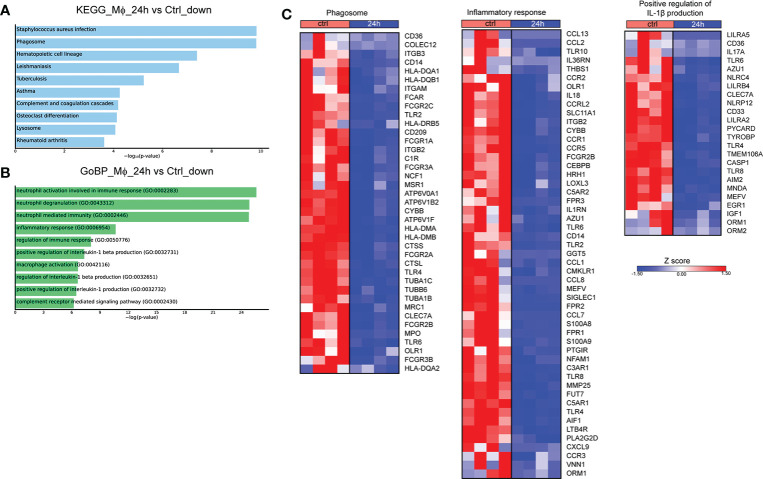
Figure 2.
Transcriptomic profiling of human Mφ infected in vitro with Brucella spp at 24h post-infection. (A) Pathway analysis of the DEGs with the highest variance at 24h post infection compared to control, using the KEGG database as reference. (B) Enriched biological processes in which the downregulated genes are involved. (C) Heatmaps depicting the DEGs of the phagosome pathway, the inflammatory response and positive regulation of IL-1β production biological processes.

