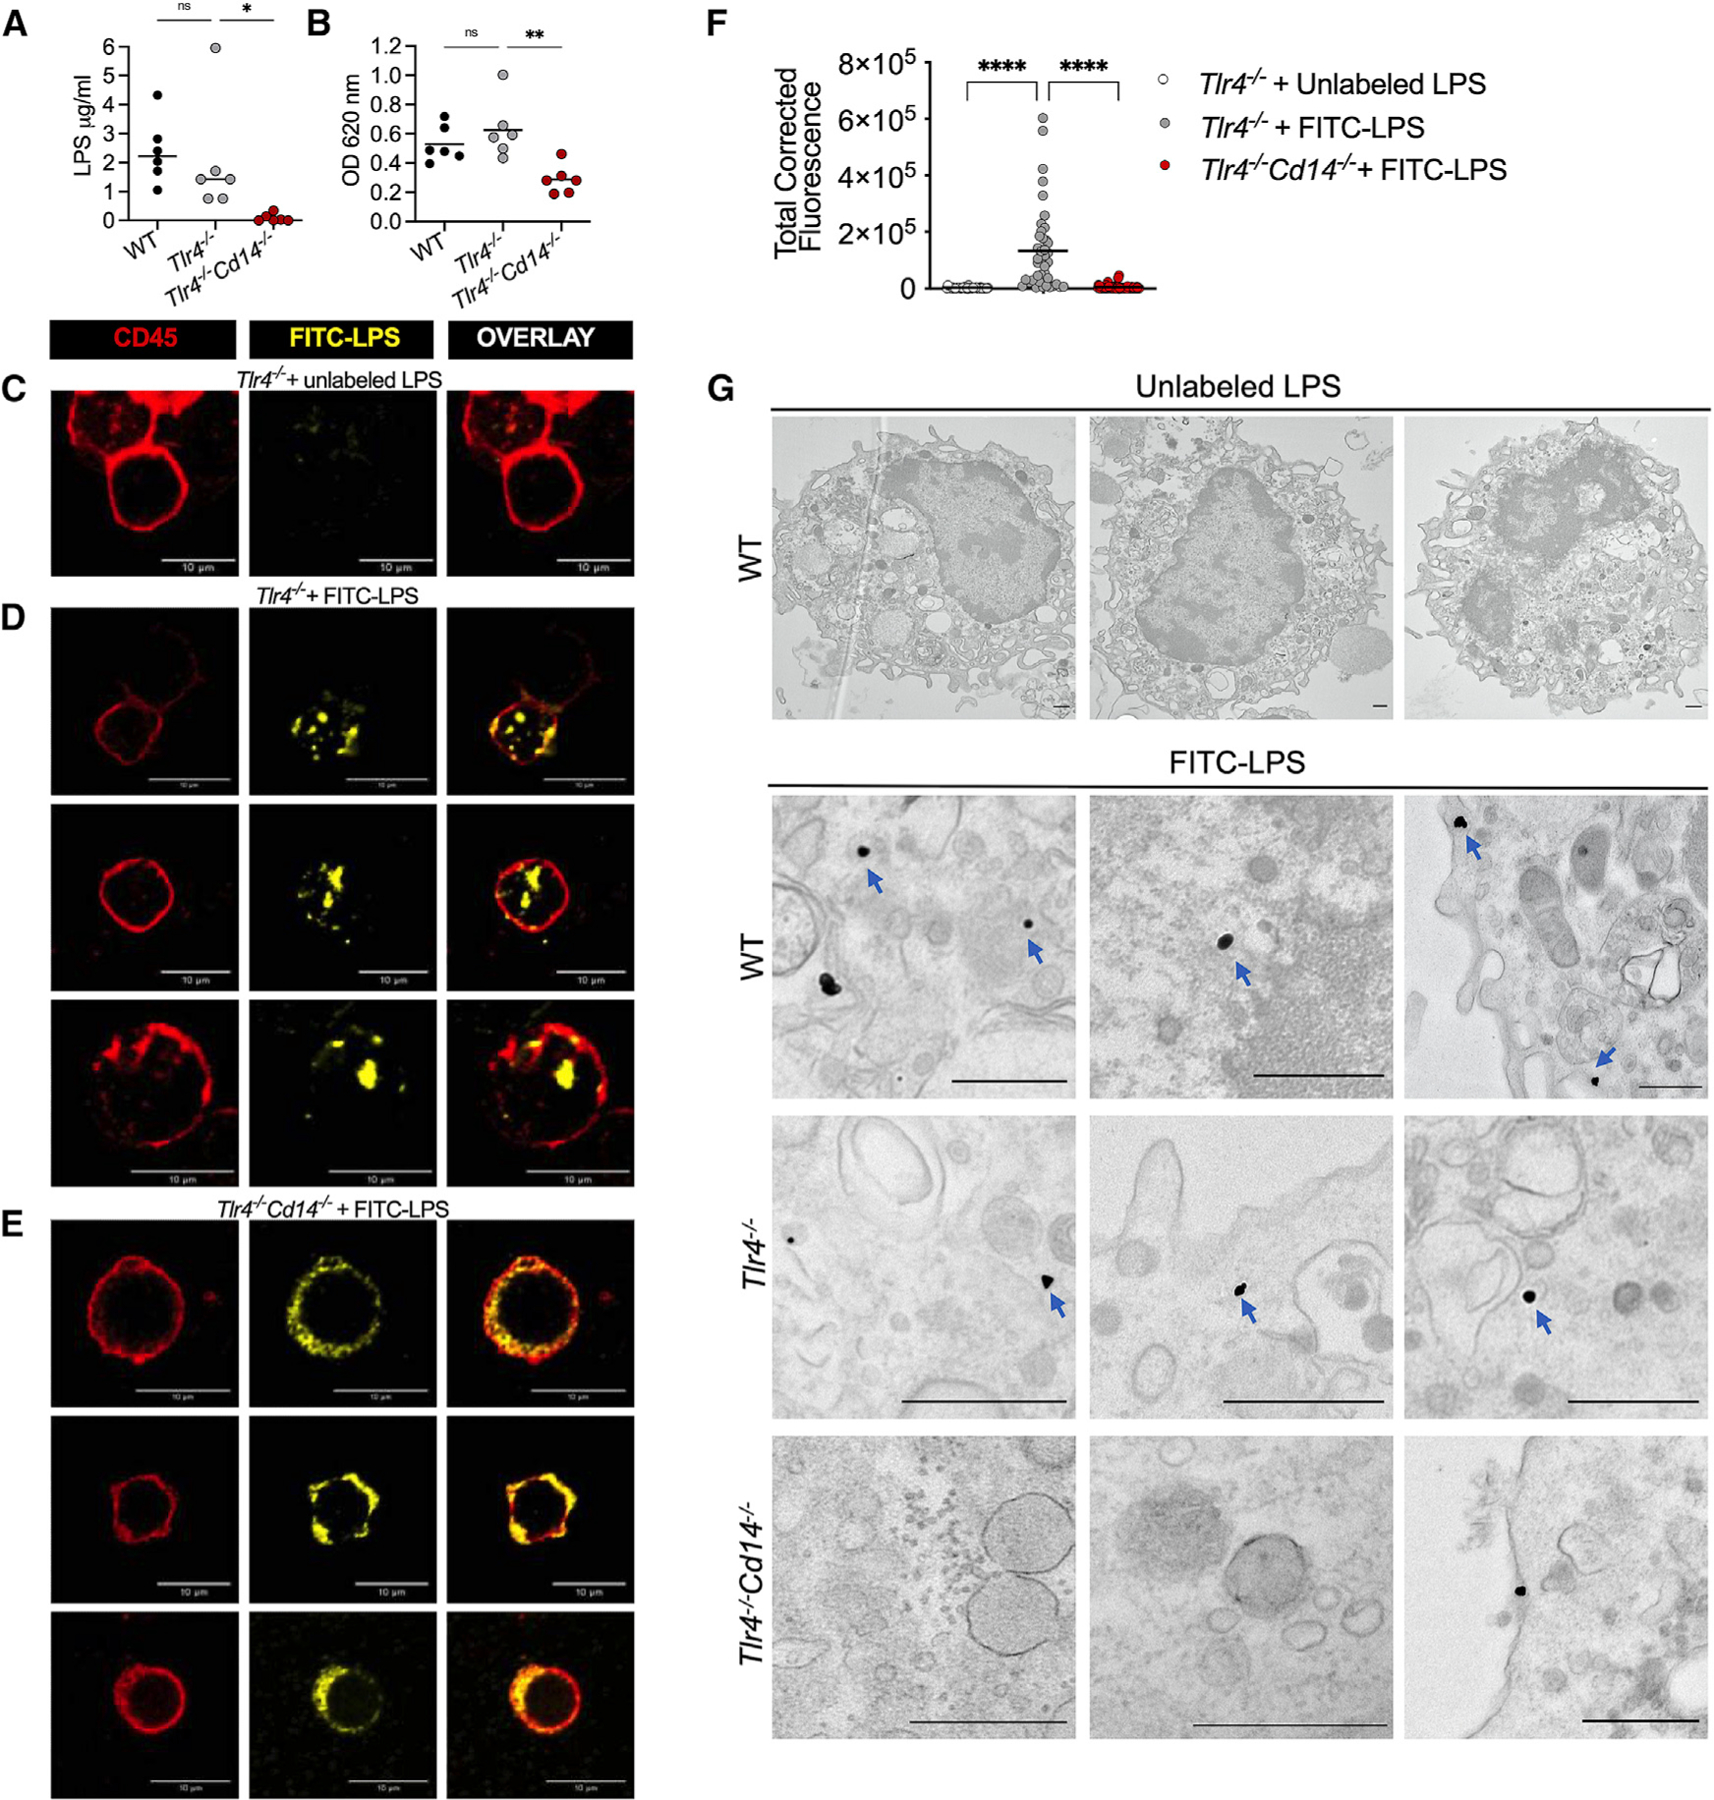
Figure 4. CD14 enables caspase-11 activation by facilitating intracellular LPS localization in vivo.

(A and B) LPS levels in the splenic myeloid cell cytosol of WT, Tlr4−/−, and Tlr4−/− Cd14−/− mice 5 h post-LPS injection assessed by the LAL (A) and HEK-TLR4 reporter cell (B) assays. Each circle represents a mouse, and horizontal lines represent mean.
(C–F) Confocal images of CD11b+ splenocytes sorted from unlabeled LPS-injected Tlr4−/− mice (C) or FITC-LPS-injected Tlr4−/− (D) and Tlr4−/− Cd14−/− (E) mice and stained with anti-FITC and anti-CD45 antibodies and the quantification of intracellular FITC-LPS intensity (F) (each circle represents a cell and horizontal lines represent mean).
(G) EM images of peritoneal lavage cells from indicated mice injected with unlabeled or FITC-labeled LPS and stained with anti-FITC gold particles. Blue arrows indicate cytosolic localization of LPS.
Data from five experiments (A and B), representative images (C–E) from four experiments, combined data (F) from four experiments, and representative images from three experiments (G) are shown. *p < 0.05; **p < 0.01; ****p < 0.0001; ns: non-significant; one-way ANOVA/Dunnett’s test. Scale bar: 10 μM (C–E) or 0.5 μM (G).
See also Figures S2, S3, and S4.
