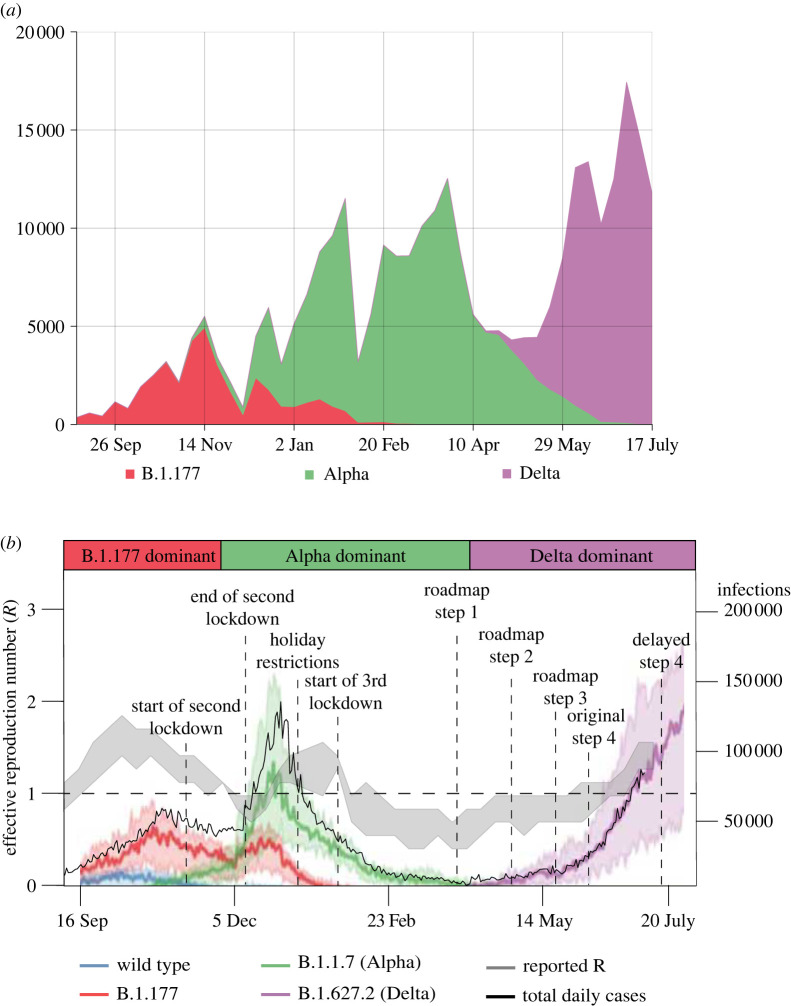
Figure 1.
(a) The frequency of different SARS-CoV-2 variants using data from the COVID-19 Genomics UK Consortium (COG-UK) [1] as absolute numbers of genomes per week (as a proxy for infections by a circulating variant) and illustrating the consecutive SARS-CoV-2 variants over the study period. (b) Covasim model-generated daily infections by different SARS-CoV-2 variant type (blue, red, green and purple lines), together with data on the total number of daily cases (black line; all on the right -axis) and the reported effective reproduction number value (grey band and on the left -axis), in England between September 2021 and June 2021. Bold coloured lines show the median over 100 simulations, and the shaded intervals around these show the 90% CI across the simulations. (Online version in colour.)

