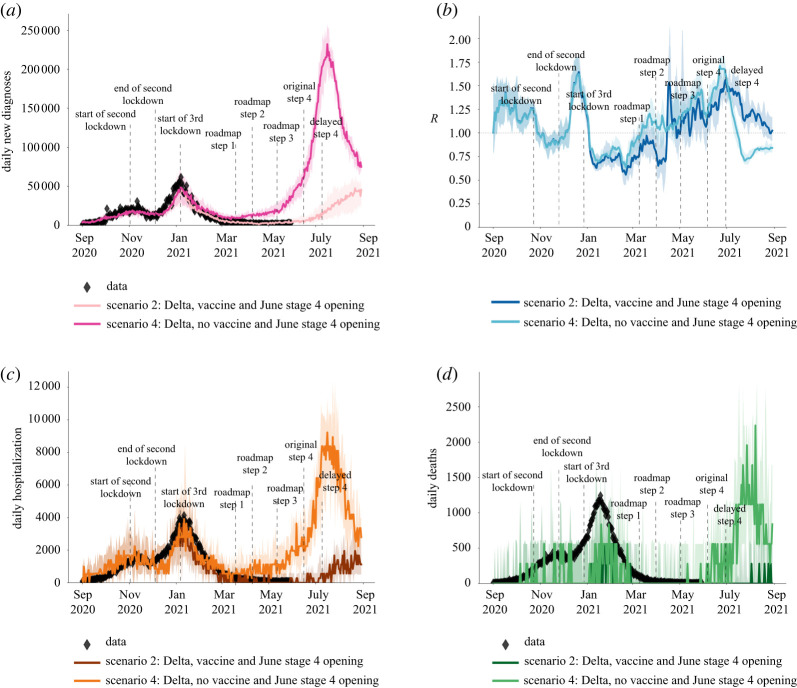
Figure 6.
The modelled impact of vaccination against COVID-19 over the first half of 2021, showing (a) the number of cases,(b) the effective reproduction number, (c) hospitalizations due to COVID-19, and (d) deaths related to COVID-19. The data from [2] is shown in diamond shapes, with the model-generated simulations overlayed. The two curves in each of the subplots illustrate the importance of vaccination in preventing surge in cases, hospitalizations and deaths, as well as an increase in effective reproduction number R in early 2021. (Online version in colour.)

