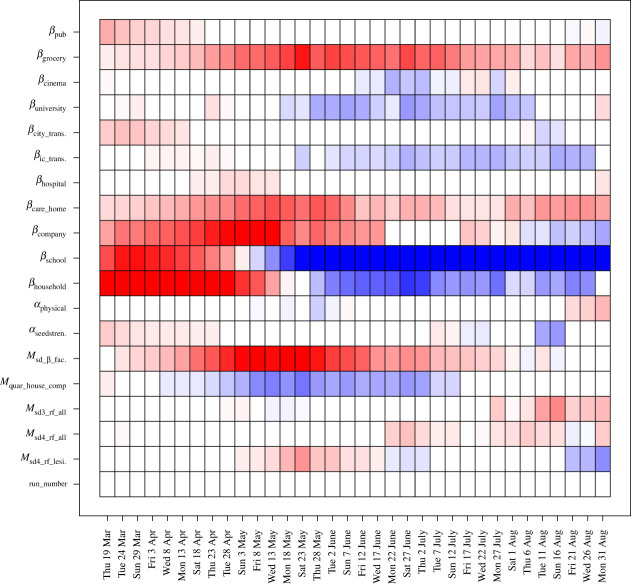
Figure 3.
Estimates for the coefficients of the linear terms that are found to feature in the emulators for total deaths in England for the first iteration/wave of runs, where labels the time point (-axis) and labels the inputs (-axis). Red/blue represents positive/negative dependencies of on that input, respectively, standardized as proportions of the largest coefficient for that time point. A finer temporal resolution is used here for added clarity. Note that this plot shows the time-dependent sensitivity of the model to the inputs, but that the actual inputs do not vary over time. (Online version in colour.)

