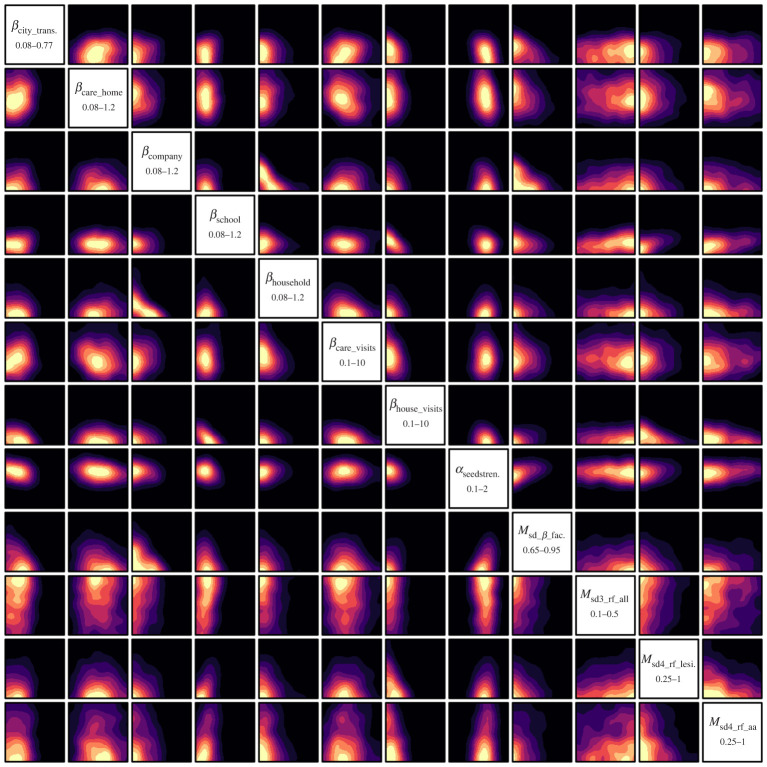
Figure 5.
The optical depth of various two-dimensional projections of the full 20-dimensional non-implausible region found after the 5th iteration. The 12 most constrained inputs are show, labelled on the diagonal (the remaining eight inputs were relatively unconstrained). The colour scales are standardized and linear in depth, with yellow showing maximum depth for that projection and purple/black showing minimum/zero depth. This region corresponds to the red runs in figure 4. (Online version in colour.)

