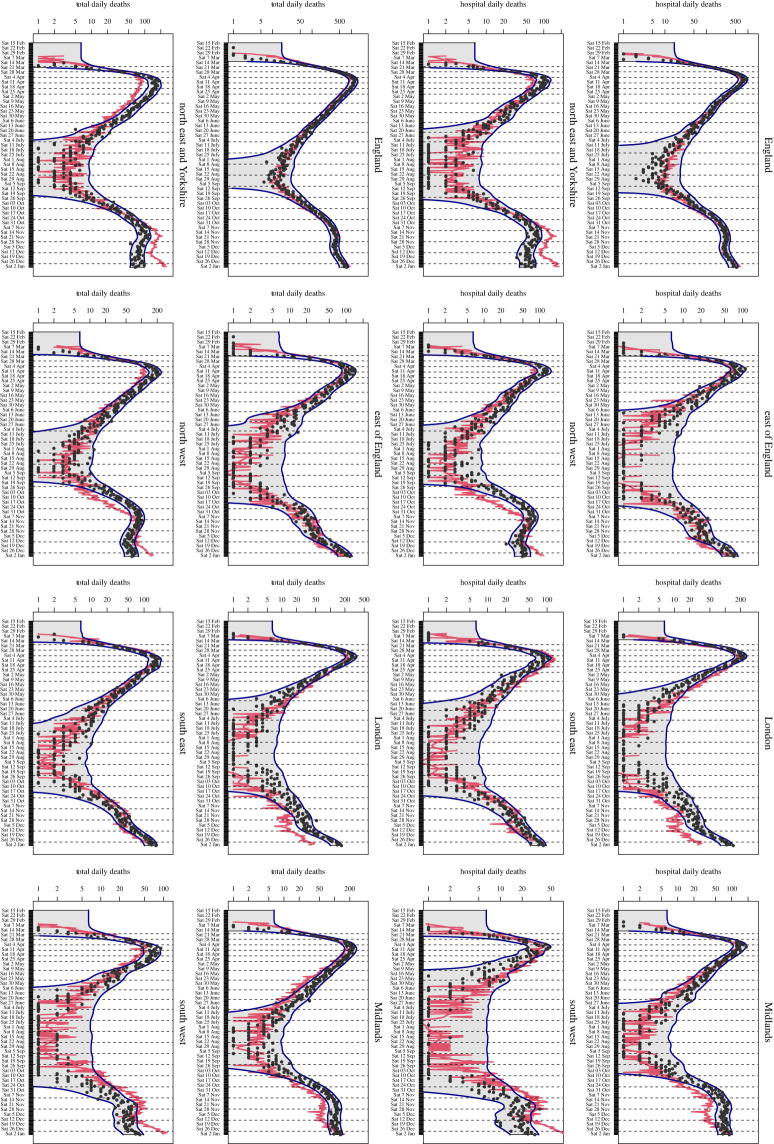
Figure 6.
A single JUNE run (red lines), from the second exploratory iteration (i.e. one of the blue lines in figure 4). The panels show hospital deaths (rows 1 and 2, viewed in landscape) and total deaths (rows 3 and 4, viewed in landscape) for England and the seven regions, as given in the plot titles. The black points give the (unsmoothed) death data, and the combined uncertainties due to and are shown as the blue lines. (Online version in colour.)

