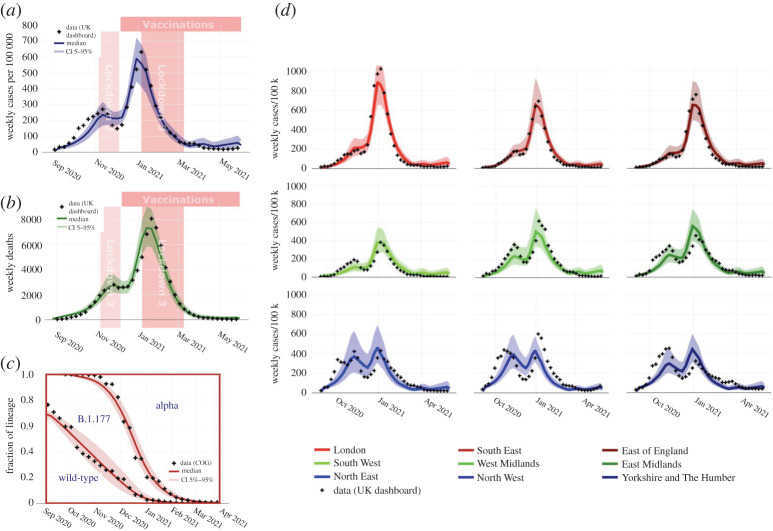
Figure 1.
Nationwide and regional epidemic time series. (a,b) The time series of the ABM ABC posterior of cases and deaths, respectively, along with the actual data [49]. (c) The time series of the model posterior of the fraction of cases by lineage along with the raw COG-UK data [41]. (d) The weekly cases per 100 k population in each of the nine English regions (electronic supplementary material, figure 3) along with the actual data [49]. The model correctly captures the shape of the curves in each region despite not containing region-specific dynamic parameters. (Online version in colour.)

