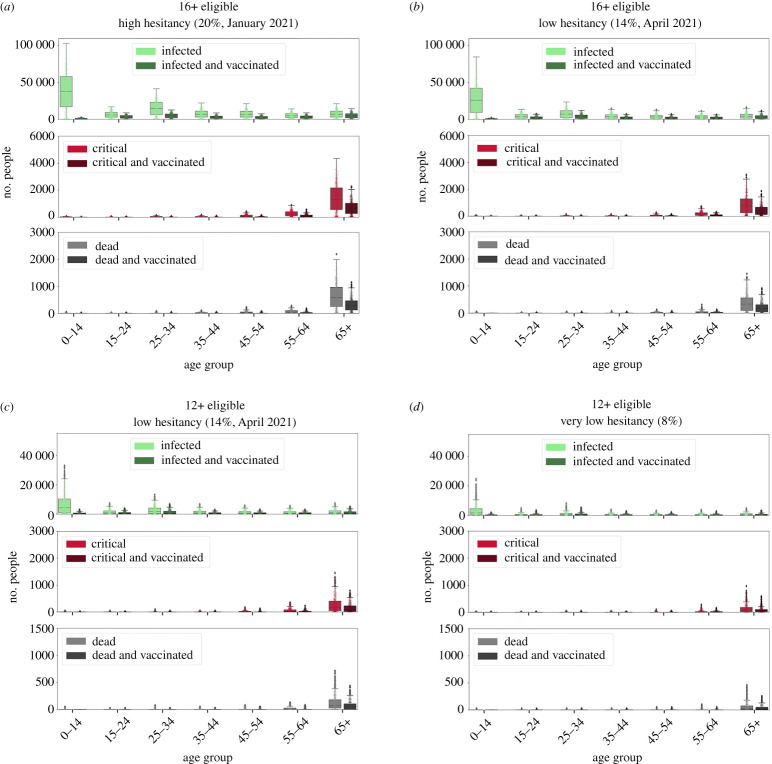
Figure 7.
A comparison of age-specific health outcomes: infections (green), critical cases (red) and deaths (grey) 90 days after the insertion of 20 agents infected with the Delta variant. (a) Eligible population aged , with age-specific hesitancy as in January 2021. (b) Eligible population aged , with hesitancy as in April 2021. (c) Eligible population aged , with hesitancy levels as in April 2021 and with individuals aged 12–17 assigned their parents’ hesitancy (i.e. in the 35–44 bracket). (d) Eligible population aged and with all agents having 8% hesitancy, which is the lowest observed in empirical data across all age groups. The values correspond to the numbers of individuals in each state and age bin (boxplot of 1000 simulations, with individual results overlaid), for all individuals (light-coloured bars) and the vaccinated subset (dark-coloured bars). The hesitancy and vaccination coverage are summarized in the electronic supplementary material, table S9. (Online version in colour.)

