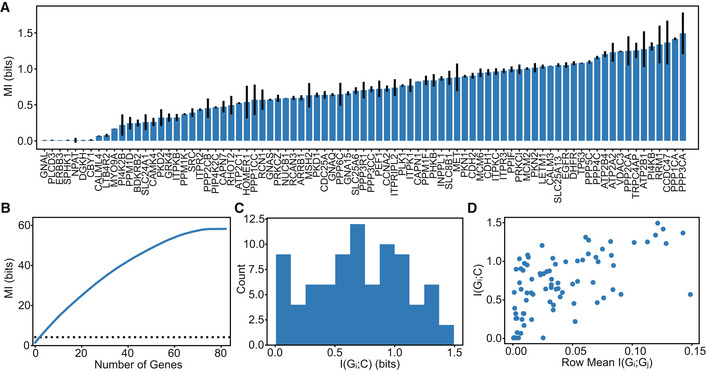
Figure 2. Mutual information between individual genes and Ca2+ signals.

-
AI(Gi;Ca2+) sorted from least to greatest. Error bars show standard deviation of three technical replicates, that is three independent runs of the MINE algorithms on the same data.
-
BThe blue line shows the cumulative sum of I(Gi;Ca2+) from (A) sorted from greatest to least, and individual genes appear to contain a lot of information (56 bits) about Ca2+ signals. The black dashed line shows mutual information between all 83 genes and Ca2+ dynamics estimated to be 2.5 bits.
-
CHistogram of (A) showing the mean I(Gi;Ca2+) is 0.7 bits.
-
DI(Gi;Gj) represents the pairwise mutual information between genes, the information that genes have about each other. This plot shows that genes that are more informative about other genes tend to be more informative about Ca2+ dynamics.
