
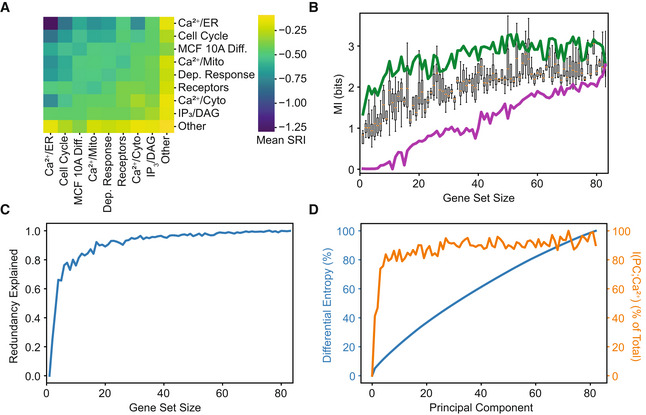
Figure 4. Mutual information between gene sets and Ca2+ signals.
-
AMean pairwise SRI from Fig 3 for sets based on annotation. MCF 10A differentiation and Ca2+‐dependent response are abbreviated.
-
BGene sets of various sizes were constructed using three different strategies: an upper bound (green) that always adds the most informative gene to the set given the genes already included, random strategy (boxes, center band shows the median, box covers the 25–75% and whiskers show 95% confidence interval. Boxes are based on 12 random samples of genes) that samples random sets of genes, and a lower bound (purple) that always adds the least informative gene to the set given the genes already included.
-
CThe blue line shows the fraction of redundant information using the expected value of I({G0, …, Gn};Ca2+) from equation (3).
-
DA y‐y plot of gene differential entropy in blue (same as Fig 1D) and the mutual information between gene principal components and Ca2+ in orange. Both values are normalized by their respective max values.