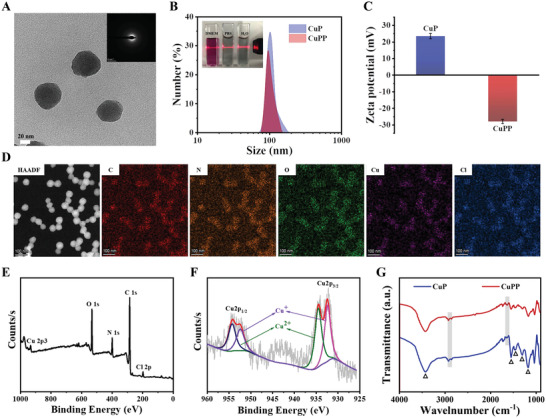
Figure 1.

A) HRTEM image of CuPP. Inset shows SAED pattern of CuPP. B) Size distribution of CuP and CuPP measured by DLS. Insets are the digital images of CuPP dispersed in pure water, PBS, and DMEM for one week. C) Zeta potentials of CuP and CuPP. Data represent means ± SD (n = 3). D) HAADF‐STEM image of CuPP and the corresponding element‐mapping images. E) XPS spectrum of CuP and F) high‐resolution Cu2p XPS spectrum of CuP spectrum. G) FTIR spectra of CuP and CuPP.
