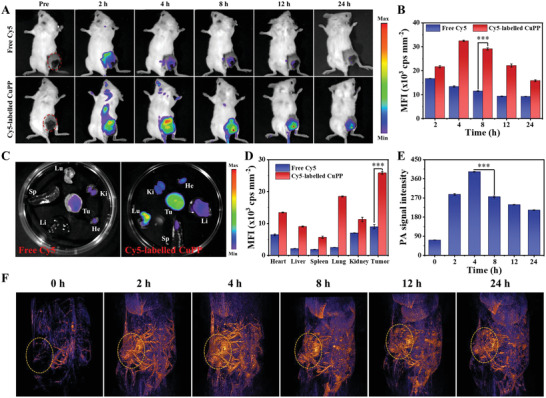
Figure 4.

A) In vivo fluorescence images of 4T1 tumor‐bearing mice at different time points after i.v. injection of free Cy5 or Cy5‐labelled CuPP. B) Quantitative analysis of fluorescence signal intensity in tumor regions. Data represent means ± SD (n = 3). C) Ex vivo fluorescence images of major organs (heart, liver, spleen, lung, and kidney) and tumor dissected from the mice after 24 h injection of free Cy5 or Cy5‐labelled CuPP. D) The quantified relative fluorescence intensity of major organs and tumors. Data represent means ± SD (n = 3). F) In vivo PA imaging and E) corresponding PA signal intensity of tumor tissue before and after i.v. administration of CuPP under 1064 nm laser irradiation at different time points (0, 2, 4, 8, 12, and 24 h). Data represent means ± SD (n = 3). Statistical significance was calculated by one‐way ANOVA analysis. *p < 0.05; **p < 0.01; ***p < 0.001.
