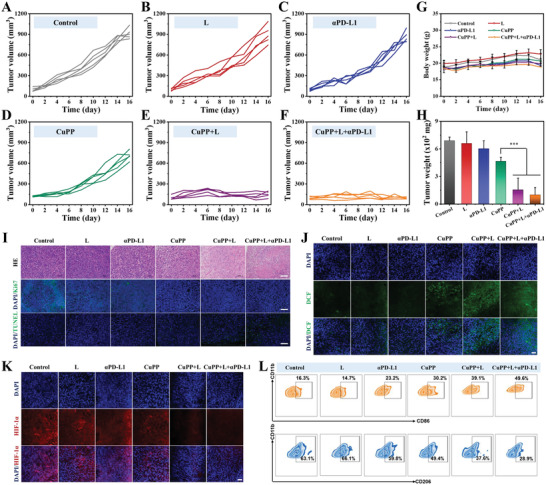
Figure 5.

A–F) Individual tumor growth curves of mice in different groups. G) Body weight curves of mice after different treatments. Data represent means ± SD (n = 5). H) Tumor weight in different groups after 16 days of treatment. Data represent means ± SD (n = 5). Statistical significance was calculated by one‐way ANOVA analysis. *p < 0.05; **p < 0.01; ***p < 0.001. I) HE staining, TUNEL staining, and Ki67 immunofluorescence staining for pathological changes and cellular proliferation in tumor tissues collected from different groups. Scale bar: 100 µm. J) In vivo ROS detection in tumor sections by dichlorodihydrofluorescein via fluorescence microscopy. Scale bar: 50 µm. K) In vivo O2 generation in tumor sections by HIF‐1α antibody via fluorescence microscopy. Scale bar: 50 µm. L) The percentage of M1 and M2 macrophages in tumors collected from different groups.
