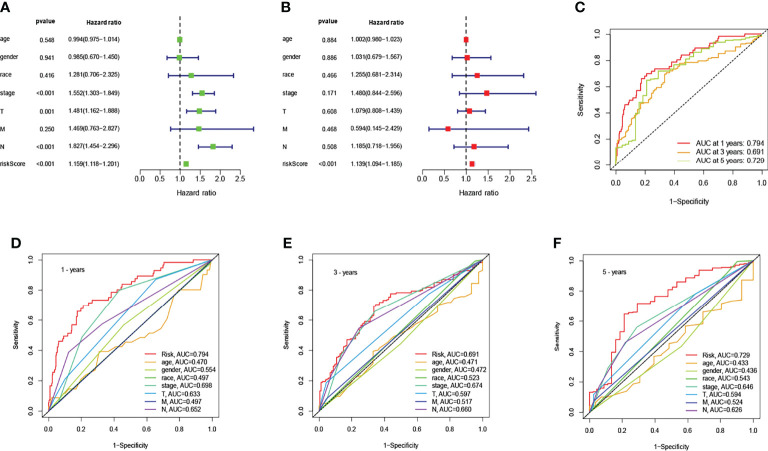
Figure 3.
Association of risk scores with clinicopathological factors. Univariate (A) and multivariate (B) Cox regression analysis of OS in the entire cohort (n = 494). The data are expressed as hazard ratio (HR) ± 95% confidence interval [CI]. The ROC of the optimal model for 1-years, 3-years, and 5-years shows AUC values of 0.794, 0.691, and 0.729, respectively (C). Comparison of the ROC curves at 1-years (D), 3-years (E), and 5-years (F) with other common clinical features showed the advantage of risk scoring.

