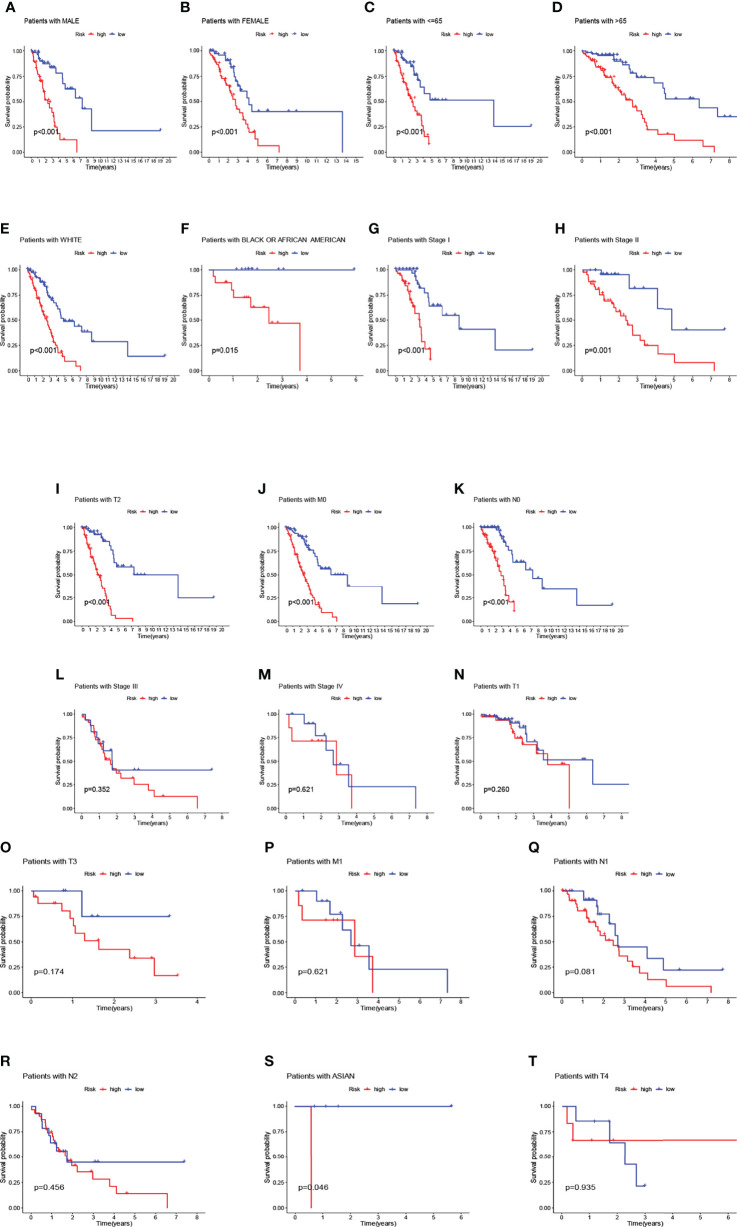
Figure 5.
Overall survival of patients with high- and low-risk NSCLC stratified by clinicopathological parameters. Kaplan-Meier survival curves showed the OS rates of high-and low-risk subgroups stratified by male (A) and female (B), age ≤ 65 (C) and > 65 (D), race-white (E), race-black or African American (F), AJCC stages I-IV, T1-T4 stage, M0-M1 stage, N0-N2 stage, race-Asian (G–T).

