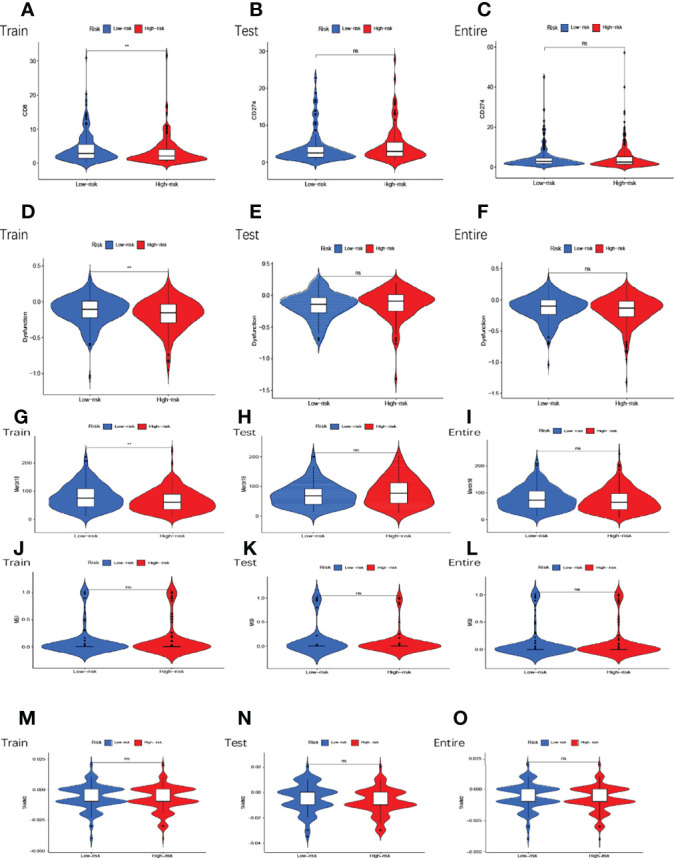
Figure 9.

Tumor microenvironment results based on GMLncSigs. Analysis of the differences among CD274 (A–C), dysfunction (D–F), Merck18 (G–I), MSI (J–L), and TAMM2 (M–O) in different risk subgroups. "*" means that P value<0.05, "**" means that P value<0.01, "***" means that P value<0.001. "ns" means no significance.
