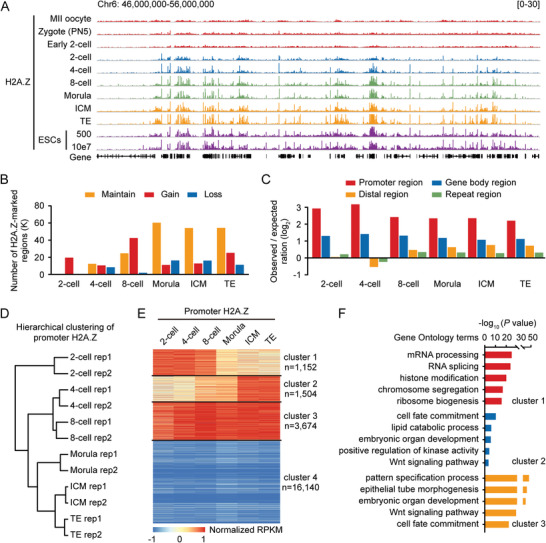
Figure 1.

Genome‐wide profiling of H2A.Z in mouse MII oocytes and early embryos. A) Genome browser snapshot of H2A.Z enrichment in mouse metaphase II (MII) oocytes, in vivo‐fertilized (IVO) embryos at the zygote, early 2‐cell, 2‐cell, 4‐cell, 8‐cell and morula stages, the inner cell mass (ICM) and the trophectoderm (TE) of blastocysts, and mouse embryonic stem cells (ESCs) (500 cells, ULI‐NChIP‐seq in this study; 10e7 cells, conventional ChIP‐seq from a previous publication[ 9a ]). Chr, chromosome; PN5, pronuclear stage 5. Two replicates of H2A.Z ULI‐NChIP‐seq are merged for each indicated stage of embryos. B) Bar charts showing the number of H2A.Z peaks gained, lost, and maintained at each stage by comparing to the previous stage. C) Bar charts showing the enrichment of H2A.Z in promoter, gene body, distal, and repeat regions. Promoter is defined as the ± 1 kb genomic region around transcription start site (TSS). D) Hierarchical clustering of promoter H2A.Z enrichment in early embryos. E) Heatmaps showing the dynamics of H2A.Z enrichment at all gene promoters (n = 22470) in early embryos. Genes are clustered into four groups by k‐means algorithms, and the numbers of genes in each cluster are shown. RPKM, reads per kilobase of bin per million mapped reads. F) Bar charts showing the enriched Gene Ontology (GO) terms for gene cluster 1–3 in (E).
