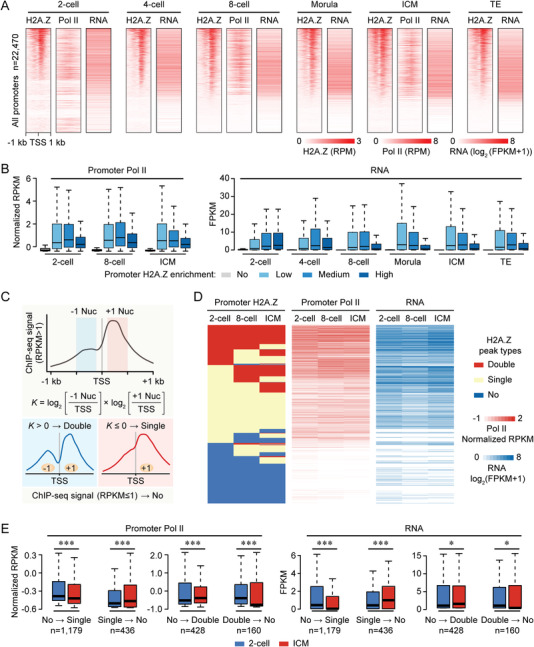
Figure 3.

Promoter H2A.Z has dual functions for gene activation and silencing. A) Heatmaps showing the H2A.Z and RNA polymerase II (Pol II) enrichment in early embryos at all gene promoters (n = 22470). Each row represents a promoter region (TSS ± 1 kb) and is ordered descending by H2A.Z enrichment. RNA levels at each stage are also shown. Pol II ChIP‐seq and RNA‐seq data for early embryos are from previous publications.[ 15 , 20 ] FPKM, fragments per kilobase of transcript per million mapped reads. B) Boxplots showing Pol II enrichment (left) and RNA levels (right) for four gene clusters in early embryos. Genes with weak promoter H2A.Z enrichment (RPKM ≤1) are extracted first, and the remaining genes are divided into three tertiles depending on promoter H2A.Z enrichment. For boxplots, middle lines indicate the median, the boxes indicate the 25th/75th percentiles, and the whiskers indicate 1.5× interquartile range (IQR). C) Schematic showing a strategy for the classification of three H2A.Z peak types at promoters. Nuc, nucleosome. D) Heatmaps showing the dynamics of promoter H2A.Z peak types (left), Pol II enrichment (middle) and RNA levels (right) in 2‐cell embryos, 8‐cell embryos and ICM. E) Boxplots showing the changes of promoter Pol II enrichment (left) and RNA levels (right) when H2A.Z peak transition occurs from 2‐cell embryos to ICM. The numbers of genes with different transition modes are shown. ***P <0.001; *P <0.05; two‐sided Wilcoxon‐Mann‐Whitney test. For boxplots, middle lines indicate the median, the boxes indicate the 25th/75th percentiles, and the whiskers indicate 1.5× IQR.
