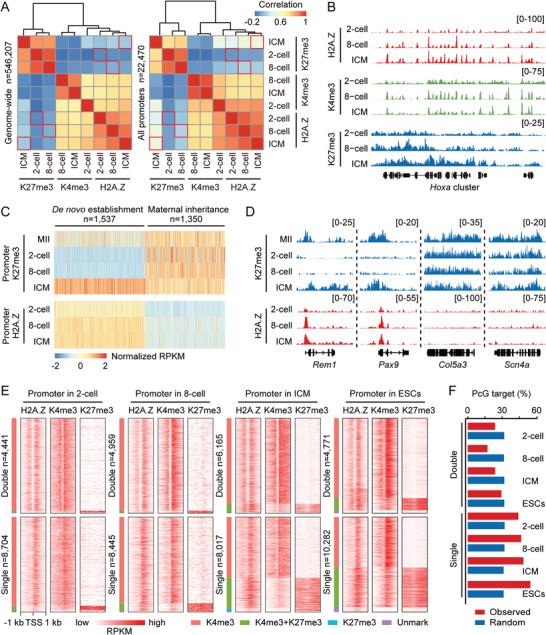
Figure 4.

Colocalization among H2A.Z, H3K4me3, and H3K27me3. A) Heatmaps and hierarchical clustering showing the Pearson's correlations among H2A.Z, H3K4me3 (K4me3) and H3K27me3 (K27me3) enrichment in 2‐cell embryos, 8‐cell embryos, and ICM on genome‐wide (5‐kb bins, n = 546207, left) and at promoters (n = 22470, right). H3K4me3 and H3K27me3 ChIP‐seq data for early embryos are from a previous publication.[ 14a ] Red boxes mark the correlations between H2A.Z and H3K27me3 in the same sample. B) Genome browser snapshot of H2A.Z, H3K4me3, and H3K27me3 enrichment in 2‐cell embryos, 8‐cell embryos and ICM near Hoxa cluster. C) Heatmaps showing the H2A.Z enrichment in early embryos at promoters with de novo established (n = 1537) or maternally inherited (n = 1350) H3K27me3 in ICM. D) Genome browser snapshot of H2A.Z and H3K27me3 enrichment in MII oocytes and early embryos near Rem1, Pax9, Col5a3, and Scn4a. E) Heatmaps showing the H2A.Z, H3K4me3, and H3K27me3 enrichment in 2‐cell embryos, 8‐cell embryos, ICM and ESCs at promoters with “Double” and “Single” H2A.Z peaks. The numbers of genes with “Double” and “Single” H2A.Z peaks in each sample are shown. Promoters are also divided into four clusters based on their histone modification patterns as follows: H3K4me3 (red), H3K27me3 (cyan), bivalent mark (H3K4me3+H3K27me3, green), and Unmark (purple). F) Percentages of genes with “Double” and “Single” H2A.Z peaks that are polycomb group (PcG) target genes in 2‐cell embryos, 8‐cell embryos, ICM and ESCs. A similar analysis for a set of random genes with the same size to the corresponding genes is performed as control.
