Figure 5.

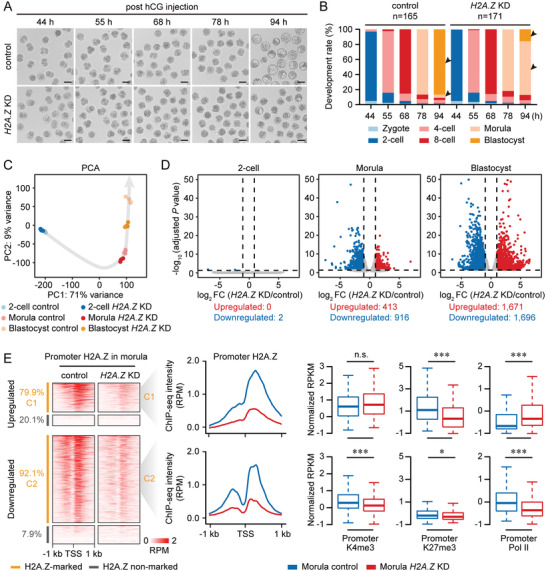
H2A.Z deficiency causes early embryonic arrest with defective transcription and histone modifications. A) Representative images of control and H2A.Z knockdown (KD) embryos at the indicated time points post hCG injection. One representative image from five independent experiments is shown. Scale bar, 100 µm. B) Bar charts showing the development rate of control and H2A.Z KD embryos at the indicated time points post hCG injection. The numbers of embryos analyzed from three independent experiments are shown. Arrows point out the developmental differences between control and H2A.Z KD embryos. C) Principal component analysis of RNA‐seq data from control and H2A.Z KD embryos at the 2‐cell, morula and blastocyst stages. 3–4 replicates of RNA‐seq are generated using control and H2A.Z KD embryos. D) Volcano plots comparing differentially expressed genes (DEGs) between control and H2A.Z KD embryos at the 2‐cell, morula and blastocyst stages. The criteria for upregulated DEGs are log2 FC >1, adjusted P value <0.05; downregulated DEGs are log2 FC <−1, adjusted P value <0.05. The numbers of upregulated and downregulated DEGs are shown. E) Heatmaps (left) showing the promoter H2A.Z enrichment of DEGs between control and H2A.Z KD morulae. Each row represents a promoter region and is ordered descending by H2A.Z enrichment. DEGs are classified into H2A.Z‐marked upregulated genes (C1, n = 330), H2A.Z‐marked downregulated genes (C2, n = 844), and nonmarked genes. Profiles (middle) showing the promoter H2A.Z enrichment of C1 and C2 in control and H2A.Z KD morulae. Boxplots (right) showing the promoter H3K4me3, H3K27me3, and Pol II enrichment of C1 and C2 in control and H2A.Z KD morulae. Two replicates of H2A.Z, H3K4me3, H3K27me3, and Pol II ULI‐NChIP‐seq are generated using control and H2A.Z KD morulae. ***P <0.001; *P <0.05; n.s., no significance; two‐sided Wilcoxon‐Mann‐Whitney test. For boxplots, middle lines indicate the median, the boxes indicate the 25th/75th percentiles, and the whiskers indicate 1.5× IQR.
