Figure 6.

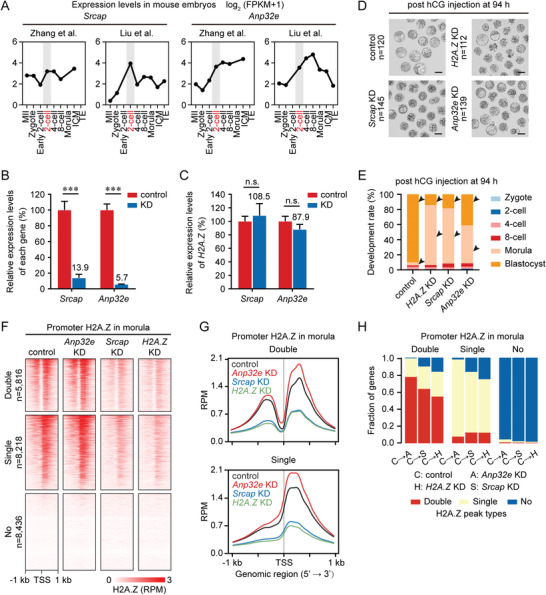
SRCAP and ANP32E deficiency impact precise H2A.Z accumulation in early embryos. A) Line graphs showing the expression levels of Srcap and Anp32e in mouse MII oocytes and early embryos by RNA‐seq. RNA‐seq data are from previous publications.[ 15c ,d] Developmental stage marked in red and gray shades indicates the corresponding zygotic genome activation (ZGA) stage. B) Bar charts showing the relative expression levels of Srcap and Anp32e in control and KD embryos at the morula stage. Gene expression levels in control embryos are set as 100%, and the relative expression levels in KD embryos are shown as percentages. Error bars represent the standard deviation (SD) in three replicates. ***P <0.001; two‐sided Student's t‐test. C) Bar charts showing the relative expression levels of H2A.Z in control, Srcap KD, and Anp32e KD embryos at the morula stage. H2A.Z expression levels in control embryos are set as 100%, and the relative H2A.Z expression levels in Srcap KD and Anp32e KD embryos are shown as percentages. Error bars represent the SD in three replicates. n.s., no significance; two‐sided Student's t‐test. D) Representative images of control, H2A.Z KD, Srcap KD, and Anp32e KD embryos at 94 h post hCG injection. One representative image and the numbers of embryos analyzed from three independent experiments are shown. Scale bar, 100 µm. E) Bar charts showing the development rate of control, H2A.Z KD, Srcap KD, and Anp32e KD embryos at 94 h post hCG injection. Arrows point out the developmental differences between control and KD embryos. F) Heatmaps showing the H2A.Z enrichment at promoters with “Double”, “Single” and “No” H2A.Z peaks in control, H2A.Z KD, Srcap KD, and Anp32e KD embryos at the morula stage. The numbers of genes with “Double”, “Single” and “No” H2A.Z peaks in control morulae are shown. Each row represents a promoter region and is ordered descending by H2A.Z enrichment. Two replicates of H2A.Z ULI‐NChIP‐seq are generated for each sample. G) Profiles showing the average promoter H2A.Z enrichment with “Double” (top) and “Single” (bottom) peaks in control, H2A.Z KD, Srcap KD, and Anp32e KD embryos at the morula stage. H) Bar charts showing the fractions of genes with different peak transition modes in H2A.Z KD, Srcap KD, and Anp32e KD morulae when compared to control morulae.
