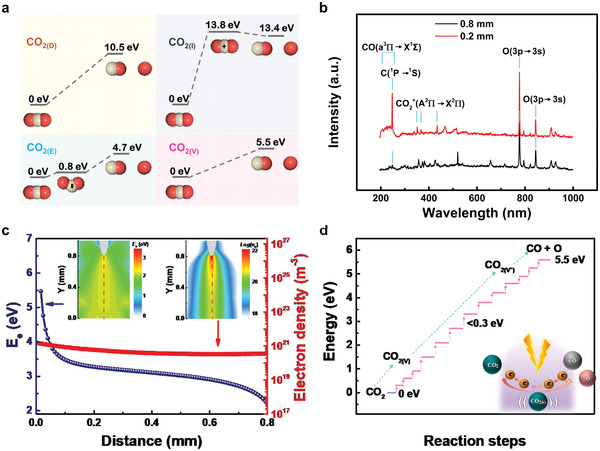
Figure 4.

Mechanism of triboelectric plasma‐driven CO2 reduction. a) Diagrams of four plausible dissociation pathways of CO2 decomposition in the plasma. b) Optical emission spectra of the triboelectric plasma with discharge distances of 0.2 and 0.8 mm. c) Average electron energy (E e) and electron density (n e) of mid perpendicular at an evolution time of 6.0 ns and a discharge distance of 0.8 mm. d) Schematic illustration of the vibrational excitation dissociation pathway. Note that CO2(v) and CO2(v*) stand for different vibrationally excited levels, being CO2(v*) at a higher level than CO2(v).
