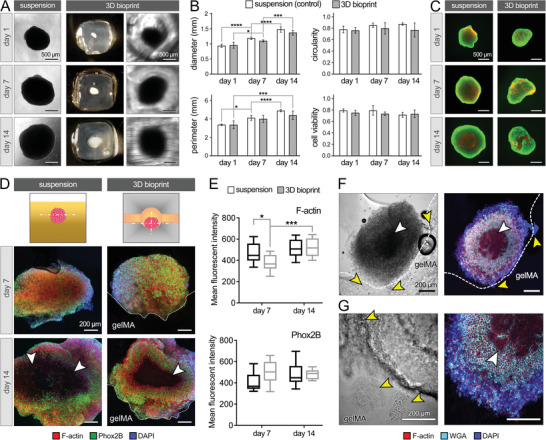
Figure 3.

NB spheroid survival, growth, and interaction with the 3D matrix in the bioprinted gelMA construct. A) NB spheroid growth from day 1 to 14 in the suspended (control) versus 3D gelMA groups. B) Quantification of NB spheroid diameter, perimeter, and circularity, based on the optical images in A (n = 6 per group), and quantification of NB cell viability based on the Live/Dead assay in C (n = 3 per group). C) Live/dead assay conducted on the whole NB spheroids in suspension (left) versus 3D bioprints (right). Scale bars in A and C represent 500 µm. D) Immunohistochemical analysis of cultured NB spheroid at days 7 and 14, staining for F‐actin (red), Phox2B (green) and DAPI (blue). E) Quantification of F‐actin (top) and Phox2B (bottom) mean fluorescent intensity obtained from confocal images in D (n = 5 per group). F,G) Interaction between NB cells and gelMA at day 14 of culture, by staining for F‐actin (red), WGA (cyan) and DAPI (blue). White arrows highlight the necrotic core in the center of spheroids. Yellow arrows point to the invasion of NB cells into the gelMA matrix. Scale bars in (D), (F) and (G) represent 200 µm. *: p <0.05, ***: p < 0.005, and ****: p < 0.001.
