Figure 5.

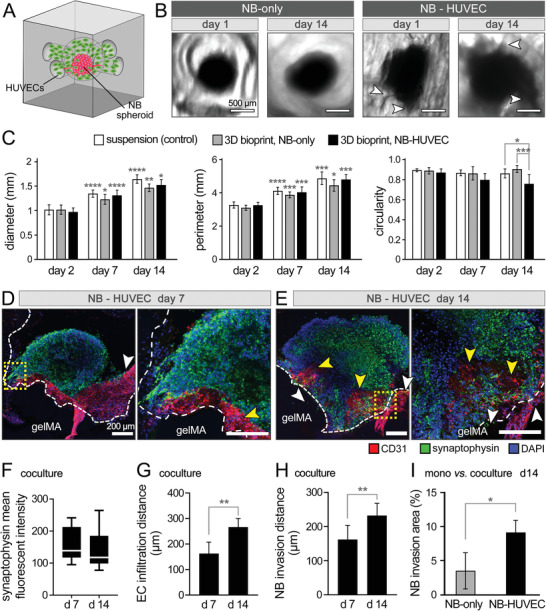
NB‐HUVEC coculture in 3D bioprinted gelMA constructs. A) Schematic illustration of the coculture. B) Bright‐field images of NB spheroids cultured for 1 and 14 days in the gelMA constructs, in the absence (NB‐only) and presence of HUVECs (NB‐HUVEC). C) Quantification of NB spheroids shape, i.e., the spheroid diameter, perimeter, and circularity of spheroids cultured in suspension (control) versus those grown in bioprinted models with or without HUVECs (n = 6 per group). D,E) Immunohistochemical imaging of the cocultured constructs at days 7 (D) and 14 (E). Confocal images show the staining results for EC‐specific CD31 (red), synaptophysin (green) and DAPI (blue). White arrows point to the NB invasion into the gelMA, and yellow arrows highlight EC infiltration into the spheroid. The gelMA boundary is depicted by dotted white line. F–H) Quantification of synaptophysin (F), NB cell invasion distance into the gelMA (G), and EC infiltration distance into the cancer spheroid (H), based on the confocal images (n = 3). I) Quantification of NB cell invasion extent into the gelMA matrix in monoculture (NB‐only) versus coculture (NB‐HUVEC) at day 14 of culture, reported as %area of gelMA tissue outside the spheroid (n = 3). Scale bars in (B) represent 500 µm and in (D) and (E) represent 200 µm. *: p <0.05, **: p < 0.01, ***: p < 0.005, and ****: p < 0.001 in comparison to the previous time point for each group.
