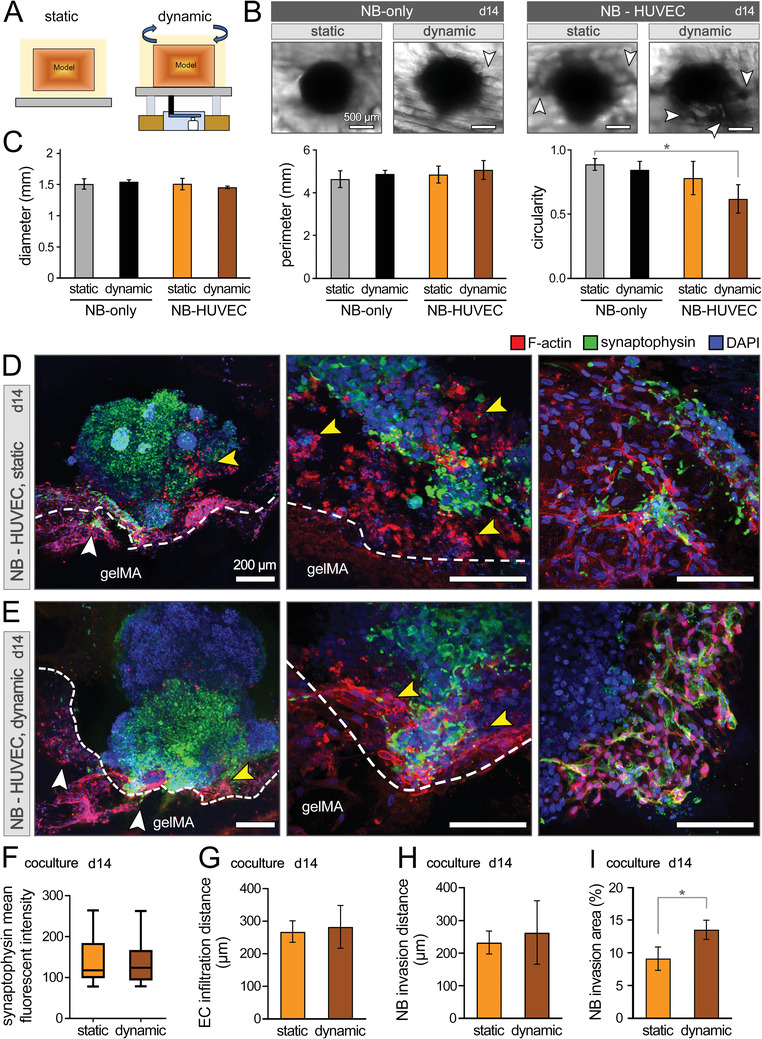
Figure 6.

NB spheroids cocultured with HUVECs in 3D bioprinted models under static and dynamic conditions. A) Scheme of experimental set‐up for static versus dynamic (rocking) culture. B) Optical images of NB spheroid morphology in the NB‐only and NB‐HUVEC coculture groups after 14 days of static and dynamic culture. White arrows highlight the NB cell invasion to the gelMA matrix. C) Quantification of NB spheroid shape in terms of diameter, perimeter, and circularity (n = 6 per group). D,E) Immunohistochemical analysis of coculture models in static (D) and dynamic (E) conditions at day 14. Confocal images at different magnifications demonstrate the NB‐EC‐gelMA matrix interactions, including the NB cell invasion towards gelMA (white arrows) and EC infiltration into the NB spheroid (yellow arrows). F–I) Quantification of synaptophysin expression of NB cells (F), EC infiltration distance into the NB spheroid (G), NB cell invasion distance into the gelMA matrix (H), and NB cell invasion extent in %area of gelMA (I) at day 14 of coculture (n = 3 per group). Scale bars in (B) represent 500 µm and in (D) and (E) represent 200 µm. *: p <0.05.
