
Figure 7.
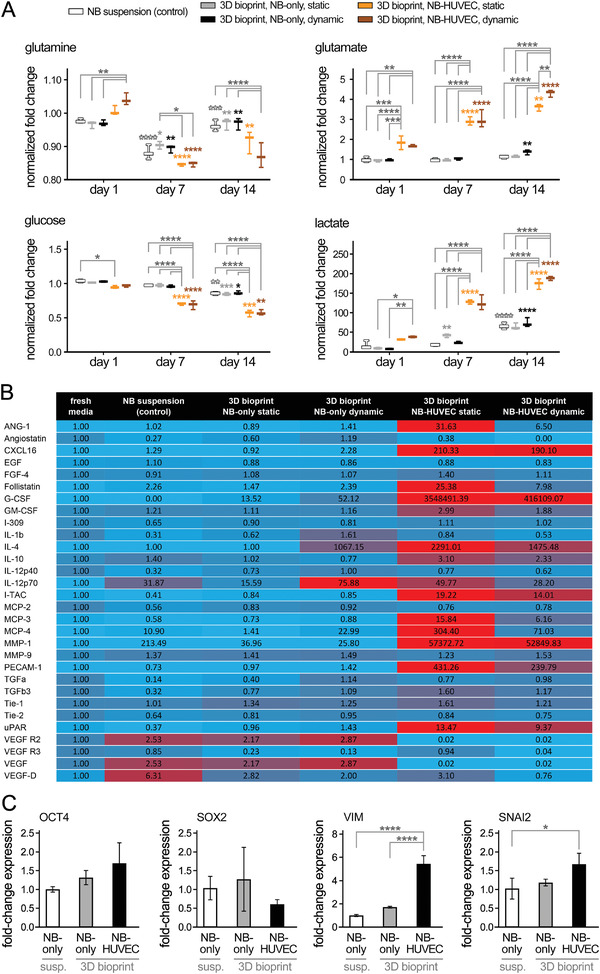
Analysis of metabolic, angiogenesis, and gene expression profiles of 3D bioprinted in vitro NB models. A) Longitudinal bioprofiling assay for nutrients (glutamine and glucose) consumption and metabolites (glutamate and lactate) accumulation, conducted on the supernatant (culture media) collected at days 1, 7, and 14 of culture (n = 4 per group). B) Angiogenesis analysis (heatmap) of various groups conducted at day 14 of culture. Culture supernatants were collected, incubated with conjugated antibodies, and analyzed using a microarray scanner. Samples from fresh culture media were used as control and normalization baseline (n = 3 per group). C) Relative gene expression (OCT4, SOX2, VIM, and SNAI2) analysis via qRT‐PCR assay conducted on the isolated NB spheroids from each condition (n = 3 per group). *: p <0.05, **: p < 0.01, ***: p < 0.005, and ****: p < 0.001 in comparison to the previous time point for each group.