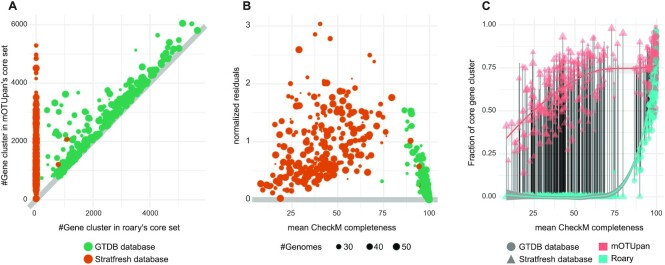
Figure 1.
Benchmarking the performance of mOTUpan against Roary along the completeness scale. Three hundred one species containing 11 570 genomes from the GTDB and 258 mOTUs containing 8955 genomes in total from the StratFreshDB are used for this comparison. Gene clusters used are the ones computed by Roary. (A) Predicted core sizes. (B) Normalized residues, fold change between core size predicted by mOTUpan and Roary; if the number is >1, mOTUpan’s prediction is larger. (C) Predicted gene clusters in core divided by estimated number of gene clusters per genome (bins below 40% completeness are ignored for this estimate) versus the mean. Local polynomial regression fitting is used in panel (C).

