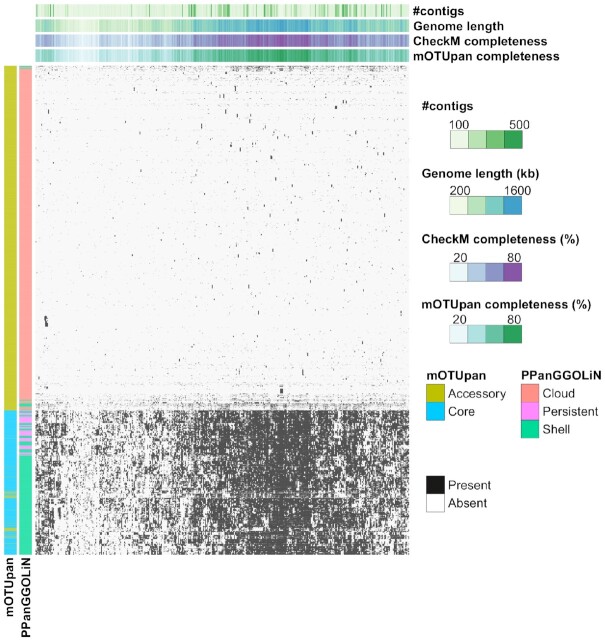
Figure 4.
Distribution of 5985 generated gene clusters from 388 genomes of a Prochlorococcus_A mOTU. Each column represents a genome, and each row represents a gene cluster. Presence/absence pattern of each gene cluster in each genome is shown in black and white, respectively. Gene clusters are assigned to different partitions using mOTUpan and PPanGGOLiN estimations. These assignments are shown in the left side of the heatmap as colored columns. Genome stats such as number of contigs, genome length, CheckM completeness and mOTUpan completeness are shown on top of the heatmap.

