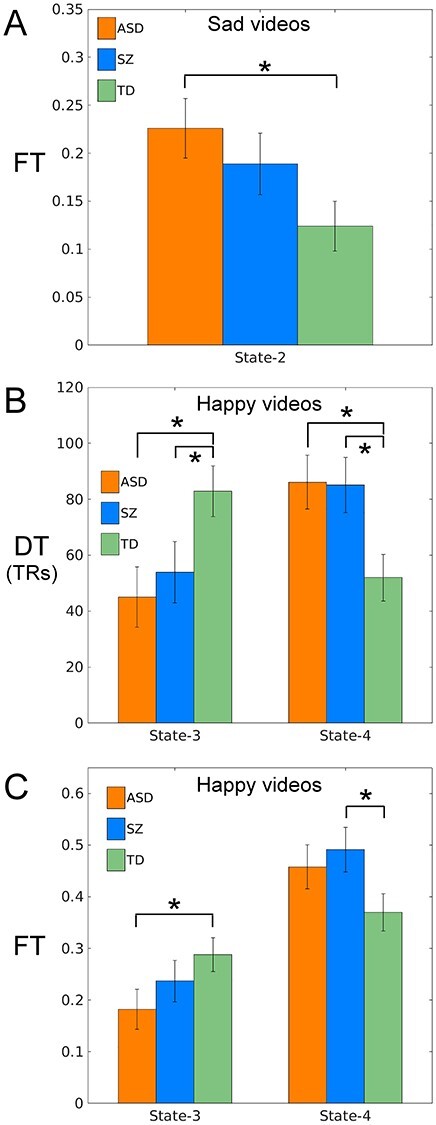
Figure 3.

Bar plots showing dS measures for groups ASD (orange), TD (green), and SZ (blue) for (A) FT for the emotion Sad and State-2 and (B) both DT and FT for the emotion Happy and State-3 and State-4. Error bars denote standard error and an asterisk denotes a significant post hoc test (P < 0.05LSD).
