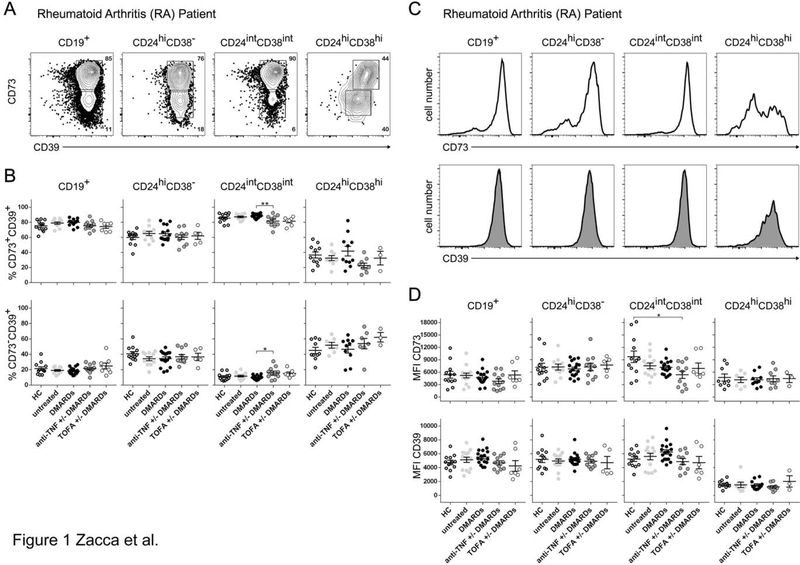
Figure 1. CD39 and CD73 expression on B cell subsets from RA patients and healthy controls.
A) Representative dot plot of CD73 versus CD39 expression on total B cells (gate on lymphocytes CD19+) and different B cell subsets: memory B cells (CD19+CD24hiCD38− cells), mature B cells (CD19+CD24intCD38int cells) and immature B cells (CD19+CD24hiCD38hi cells) from untreated RA patients. B) Frequencies of CD73+CD39+ and CD73−CD30+ cells in total B cells and memory, mature and immature B cells in HC (n = 12), untreated (n = 13) or treated RA patients (csDMARDs, n = 17; anti-TNF+/− csDMARDS, n = 11; TOFA+/− csDMARDS, n = 7). Data are expressed as mean ±SEM. C) Representative histogram of CD73 or CD39 expression on total B cells (gate on lymphocytes CD19+) and the different B cell subsets from untreated RA patients D) Mean fluorescence intensity (MFI) of CD73 or CD39 on total, memory, mature and immature B cells (gated as mentioned before) from HC (n = 12), untreated (n = 13) or treated RA patients (csDMARDs, n = 17; anti-TNF+/− csDMARDS, n = 14; TOFA+/− csDMARDS, n = 7. MFI for immature B cells was determined on CD73+ or CD39+ cells.
p<0.05, **p<0.01, ***p<0.001. Kruskal-Wallis test with Dunn’s correction was used. csDMARDS is indicated as DMARDS.

