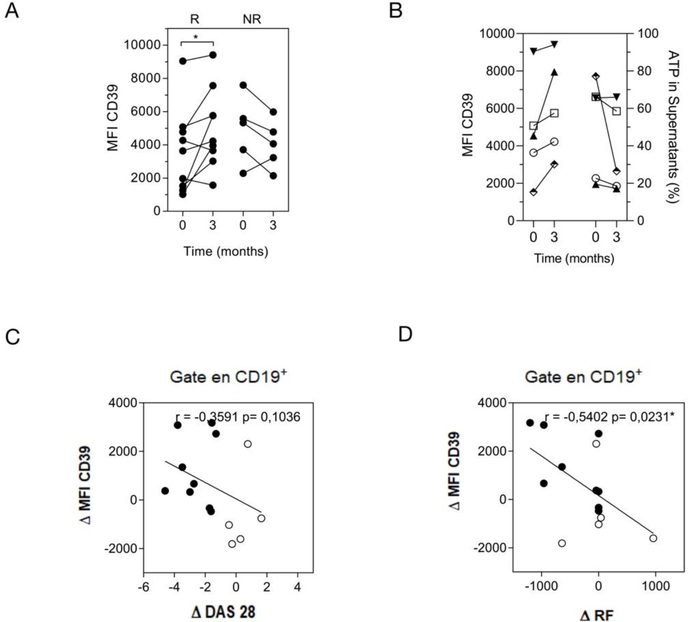
Figure 3. B cells from RA patients increased CD39 expression after good response to treatment.
A) Mean fluorescence intensity (MFI) of CD39 on total B cells (CD19+CD4−CD8−) at baseline (time 0) and after 3 months (time 3) of treatment in good responder (R) and non-responder (NR) patients. (R n=9 and NR n=5). B) MFI of CD39 on total B cells from the same R-RA patient before (0) and after treatment (3) is shown together with ATP hydrolysis (ATP % in supernatant). C-D) Correlation plots show the relationship between the delta of mean fluorescence intensity (MFI) of CD39 on B cells, determined as the difference between the value of MFI after and before treatment (0–3 months) versus (C) delta of DAS 28 (0–3 months) and (D) delta of the titer of RF (0–3 months). Full and empty circles represent R and NR patients, respectively. Correlation analysis was performed with Pearson’s correlation test. p<0.05 was considered statistically significant.

