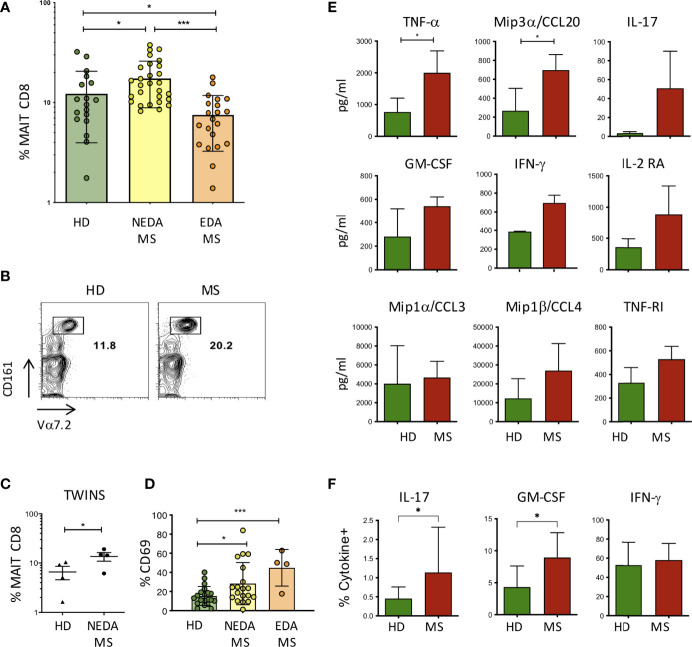
Figure 3.
MAIT cells in pwMS and HD. (A) Frequency of MAIT cells, measured as a percentage of total CD8+ T lymphocytes, in the peripheral blood of HD (n = 18) and in NEDA-MS (n = 28) and EDA-MS (n = 21) patients. Bars represent mean with SD. (B) Representative plot of CD8, Vα7.2, and CD161 positive cells in a pair of twins. (C) Cumulative data of MAIT cell frequency in 4 pairs of homozygous twins. Horizontal bars represent mean with SD. (D) CD69 expression by MAIT cells measured in freshly isolated PBMC ex vivo, in HD (n = 20), NEDA-MS (n = 19), and EDA-MS (n = 4). Bars represent mean with SD. (E) Production of cytokines by MAIT cells. CD3+ CD8+ CD161+ Vα7.2 + cells were sorted (purity> 95%) and cultured, then stimulated for 72 h with Dynabeads T-Activator CD3/CD28. The supernatants were then collected and the presence of cytokines in the supernatant was measured with Luminex (n = 3). Bars represent SD. (F) Cumulative data of IFNγ+ (HD n = 22; MS n = 28), IL-17A+ (HD n = 14; MS n = 24), and GM-CSF+ (HD n = 22; MS n = 28) percentage of MAIT cells following maximal stimulation with PMA and ionomycin of freshly obtained PBMCs from HD and NEDA-pwMS (see Supplementary Figure 1 for intracellular staining analysis and gate positioning). Bars represent SD. Statistical significance was assessed by unpaired (A, D–F) or paired (C) t-test. *p < 0.05, ***p < 0.001.

