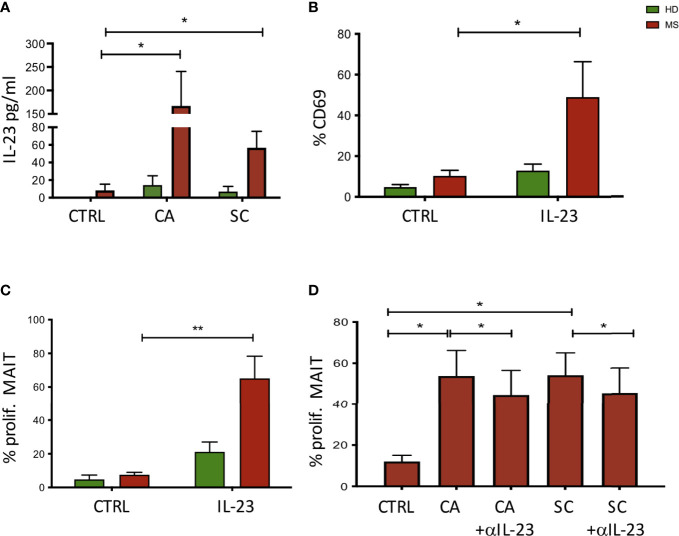
Figure 5.
(A) Activation of monocyte cells following exposure to fungal extracts. n = 9 NEDA pwMS and 9 HD. After stimulation, the supernatants were collected and the cytokine production was measured using ELISA. (B) Activation of MAIT cells following exposure to IL-23. Fresh PBMCs were incubated with IL-23, and CD69 expression was measured after 70 h by flow cytometry analysis. n = 5 pwMS and 6 HD. (C) Proliferation of MAIT cells following exposure to IL-23. Fresh PBMCs were labeled with CFSE for 5 days. After 5 days, cells were collected and MAIT cell proliferation was measured by flow cytometry. n = 4 pwMS and 4 HD. (D) Proliferation of MAIT cells following exposure to fungal extracts and IL-23 neutralizing antibodies (n = 6). Fresh PBMC (ex vivo) were incubated with CFSE dilution for 5 days and IL-23 neutralizing antibodies. Cells were then stained and analyzed by flow cytometry. Bars represent mean with SEM. Statistical significance was assessed by paired t-test. *p < 0.05, **p < 0.01.

