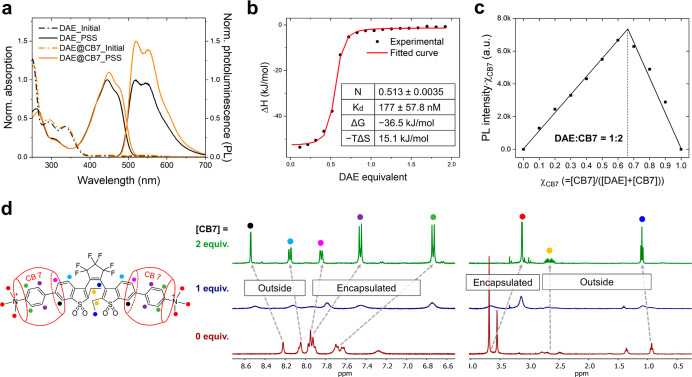
Figure 2.
(a) Normalized absorption and PL spectra of DAE (black dashed lines for the initial state and black solid lines for the PSS) and DAE@CB7 complex (orange dashed lines for the initial state and orange solid lines for the PSS) in aqueous solution (10 μM). Irradiation with UV light to reach PSS states. (b) ITC profiles: integrated heat (experimental) and fitted curve of titrating 1000 μM DAE into 100 μM CB7 in water at 25 °C. (c) Job’s plot derived from PL intensities observed for complexation of DAE and CB7 ([DAE] + [CB7] = 10 μM, χCB7 is the molar fraction of CB7 in a mixture). (d) 1H NMR spectra of the open-ring isomer DAE upon addition of CB7 in D2O ([DAE] = 2 mM).

