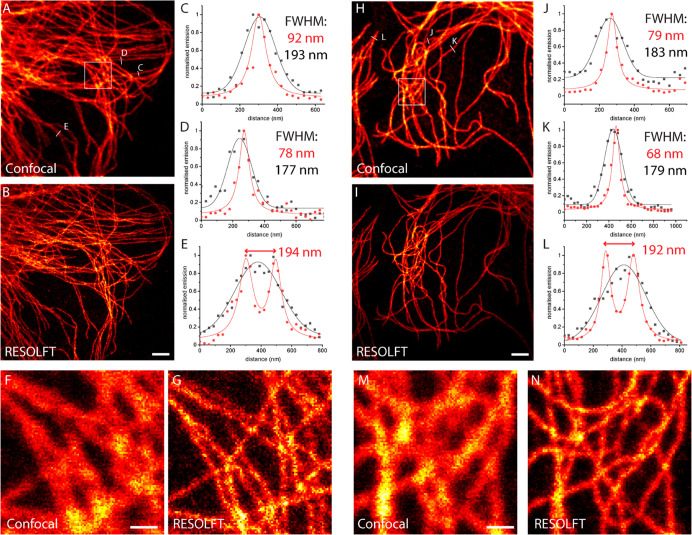
Figure 6.
Confocal (A) and RESOLFT (B) images of microtubules on fixed CV1 cells stained with secondary antibodies labeled with DAE-Male3 and mounted in PBS supplemented with CB7 (2 mM). (C–E) Line profiles along indicated lines show the experimental data (circles) and fitted data (lines). (F,G) Magnifications of the areas indicated in (A). The corresponding results with DAE-NHS (with CB7) at the same conditions: confocal (H) and RESOLFT (I) images and (J,K) line profiles. (M,N) Magnifications of the areas indicated in (H). Confocal data (black symbols and lines) were fitted with a Gaussian function and RESOLFT data (red symbols and lines) with a Lorentzian function. Scale bars: 2 μm (A, B, H, I); 0.5 μm (F, G, M, N).

