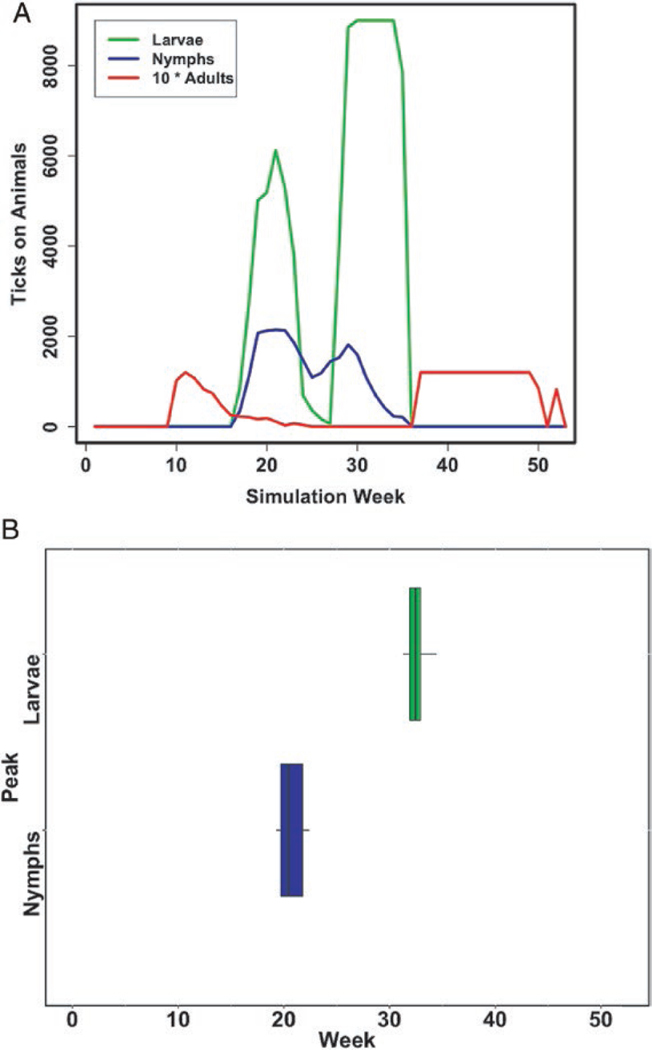
Fig. 2.
Long-term average phenology for Cary, New York from (a) model prediction and (b) field data. The graph shows the total number of larval, nymphal, and adult (multiplied by 10) ticks on all host types predicted for each week. This model scenario is based on the average of weather conditions from 2007 to 2016. The field data show the timing of the peak for larval (right) and nymphal (left) ticks for 1994–2012 as reported by Levi et al. (2015). The field data are offset by life stage simply for readability. The timing of the nymphs and larvae for New York for the long-term data fall within the ranges expected, and the overlap of the life stages is similar to that found in many years in the data from Levi et al. (2015).

