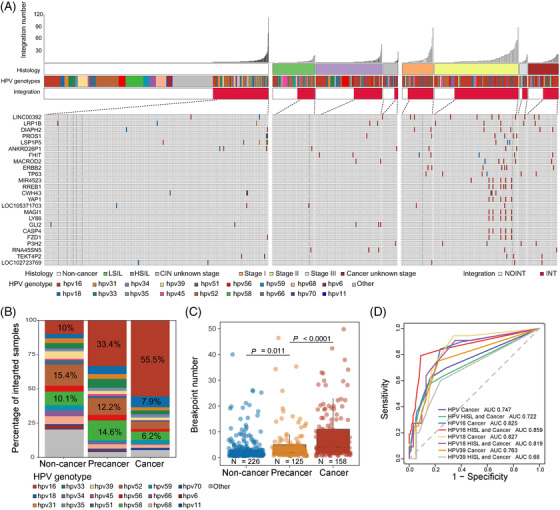
FIGURE 1.

Theintegration landscape of new human papillomavirus (HPV) positive samples. (A) The landscape of our new HPV positive samples, including 910 HPV infection samples, 329 cervical precancer samples and 227 cervical cancer samples. The integration sample proportions were 24.8% for non‐cancer HPV infection (225/910), 38.0% for cervical precancer (125/329) and 69.0% for cancer stages (158/227). Among previous HPV‐integrated samples, there were 24 recurrent integration genes (n ≥ 5 samples) were shown; (B) the distribution of integrated HPV strains in three cervical disease stages. The percentages of top three HPV strains were marked; (C) the average integration events among non‐cancer infection, cervical precancer and cancer. Adjusted p values were calculated by Wilcox test; (D) the ROC of different HPV strains’ average integration events to predict stages more severe than high‐grade squamous intraepithelial lesion (HSIL) (HSIL and cancer) or cancer
