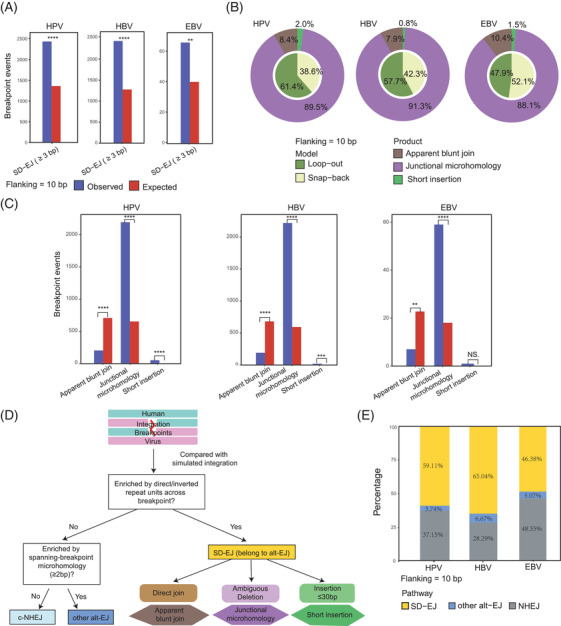
FIGURE 3.

The synthesis‐dependent end‐joining (SD‐EJ) pathways in human papillomavirus (HPV), hepatitis B virus (HBV) and Epstein–Barr virus (EBV) integration datasets. (A) The comparison of integration events with SD‐EJ repeats (≥3 bp) between observed (actual) and expected (simulated) groups within 10‐bp flanking length. The previous p values were calculated by Fisher's exact test. *p < .05, **p < .01, ***p < .001, ****p < .0001; (B) the composition of two models (loop‐out and snap‐back) and three products (apparent blunt join, junctional microhomology and short insertion) of SD‐EJ integration events in HPV, HBV and EBV datasets within 10‐bp flanking length; (C) the comparison of three products (apparent blunt join, junctional microhomology and short insertion) between observed and expected groups within 10‐bp flanking length for HPV, HBV, EBV datasets. The previous p values were calculated by Fisher's exact test. *p < .05, **p < .01, ***p < .001, ****p < .0001. (D) The workflow details of further classification of integration pathways; (E) the proportions of SD‐EJ, other alt‐EJ and c‐NHEJ pathways in HPV, HBV and EBV datasets within 10‐bp flanking length
