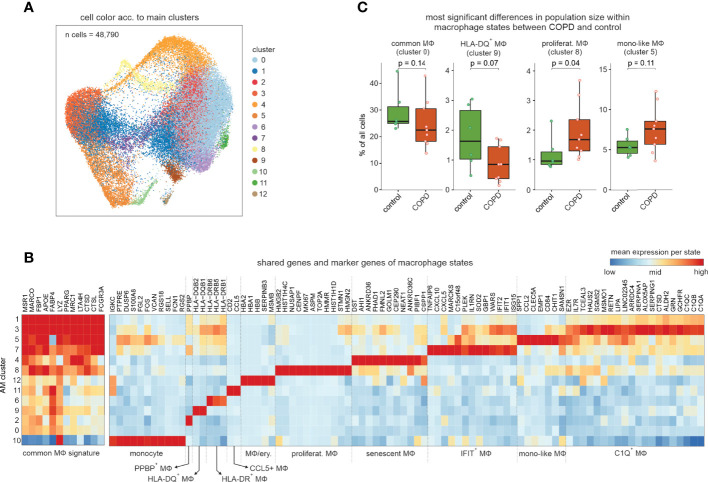
Figure 2.
Exploration of the macrophage and monocyte cell types and states in human BALF. (A) UMAP representation and clustering of cells annotated as monocytes or macrophages by the four-step annotation approach (according to Figure 1). (B) Heatmap of marker genes per macrophage/monocyte cluster (referred to as ‘macrophage states’; according to Figure 2A). The marker gene expression per macrophage state is represented as a z-transformed value across all macrophage states. On the left side of the heatmap, conserved macrophage markers are depicted. Columns and rows of the heatmap are sorted by hierarchical clustering. (C) Box visualization plot (with marked median values) of most significant differences in population sizes within the identified macrophage states between COPD and control (error bars indicating the standard deviation; statistics based on Wilcoxon rank sum test). n, number; MФ, macrophage.

