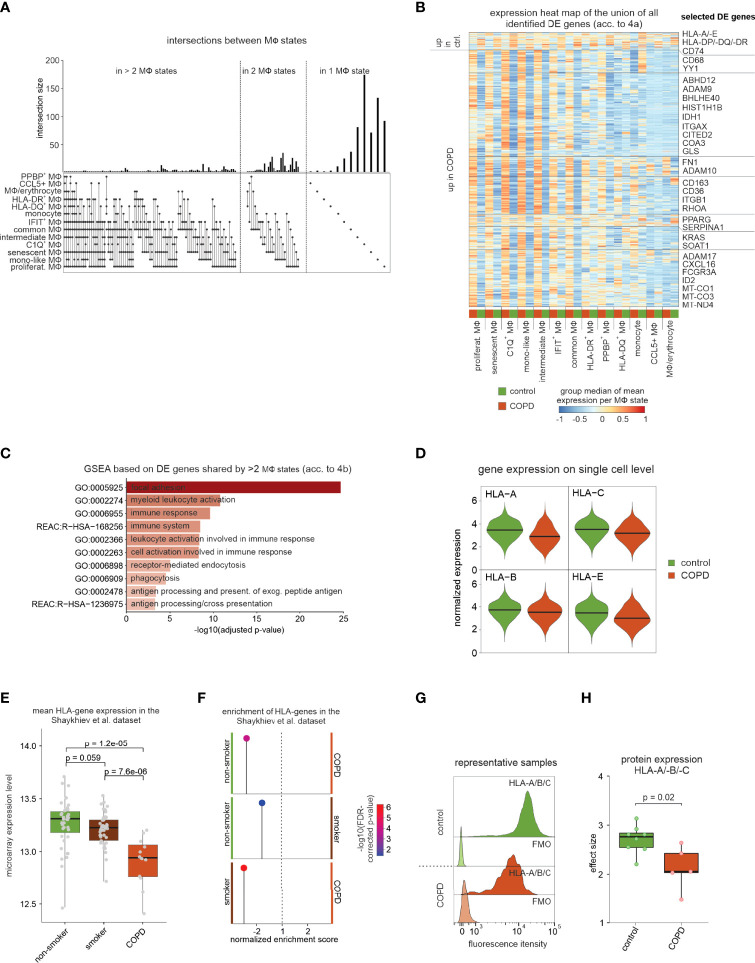
Figure 4.
DE gene analysis of identified macrophage states. (A) UpSet plot of calculated DE genes across macrophage states. DE genes found in the same states are binned and the size of the bins is represented as a bar chart. At the bottom, dots indicate which macrophage states contained and shared these DE genes. (B) Heat map representation of the union of all DE genes found in the macrophage states. Depicted is the group median (group = COPD or control) of the z-transformed mean expression data per donor and macrophage state across all macrophage states, and the names of some selected DE genes are shown on the right side of the plot. Columns and rows of the heat map are sorted by hierarchical clustering. (C) Selected functional gene sets from GSEA based on DE genes that reach the defined significance cutoffs for more than two macrophage states (acc. to Figure 4B). (D) Violin plot with marked median of HLA-A/-B/-C and -E expression in all macrophages based on scRNA-seq data. The plot shows the expression across the donors, whereby the donors were downsampled to the same number of cells, followed by downsampling to the same number of cells between COPD and control. The plot displays cells with an expression > 0. (E) Box plots (with marked median values) showing the mean expression per sample of HLA genes expressed in macrophages (error bars indicating the standard deviation; statistics are based on the Wilcoxon rank sum test). The data are obtained from Shaykhiev et al. (17). (F) Pin plot representing the enrichments in the samples of Shaykhiev et al. of HLA genes expressed in macrophages. (G) Fluorescence intensity histograms showing representative samples of flow cytometric analysis of HLA-A/-B/-C expression on the cell surface of isolated macrophages (FMO = fluorescence minus one). (H) Box plots with marked median of the calculated effect sizes of HLA-A/-B/-C expression in COPD and control with the representation of individual donors (control n = 8, COPD n = 5; error bars indicating the standard deviation; statistics based on Wilcoxon rank sum test). MФ, macrophage; mono, monocyte; DE, differentially expressed; GSEA, gene set enrichment analysis; FDR, false discovery rate; FMO, fluorescence minus one.

