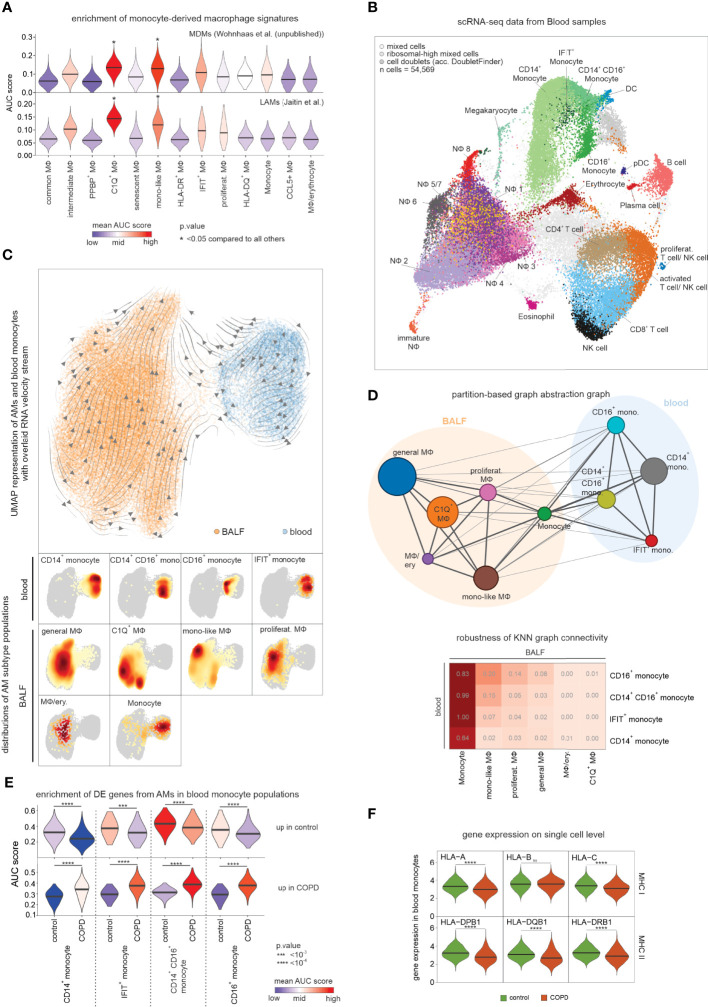
Figure 6.
Assessing the relationship between blood monocytes and BALF macrophages. (A) Violin plots (with marked median values) displaying enrichment of human orthologues of murine monocyte-derived macrophage signature genes across macrophage states in COPD and control based on Area Under the Curve (AUC). (B) Integrated scRNA-seq data of blood immune cells annotated according to the four-step annotation approach (according to Figure 1B). (C) UMAP of embedded macrophages/monocytes from BALF and blood monocytes. Inferred main average vector flow is indicated by velocity streamlines that are projected as vectors. Locations of the main cell types (acc. to the combined labels from Figure S6A) in the UMAP are indicated by the heat maps at the bottom. (D) PAGA graph derived from embedded BALF and blood data (according to Figure 6C). The weight of an edge, which reflects a statistical measure of connectivity, is represented as the edge width. The table below summarizes the results of the PAGA connectivity calculation, where a value of 1 indicates a strong connection and 0 indicates a weak connection between two cell types. (E) Violin plots (with marked median values) displaying enrichment of macrophage-related DE genes (according to Figures 4B, C) in blood monocytes based on AUC. (F) Violin plots with marked median of the expression of HLA genes, in blood monocytes based on scRNA-seq data. The plots show the expression across the donors, whereby the donors were downsampled to the same number of cells, followed by downsampling to the same number of cells between COPD and control. The plots display cells with an expression > 0. BALF, bronchoalveolar lavage fluid; mono, monocyte; MФ, macrophage; NФ, neutrophil; proliferat., proliferating; MDM, monocyte-derived macrophage; LAM, lipid-associated macrophage; ns, means not significant.

