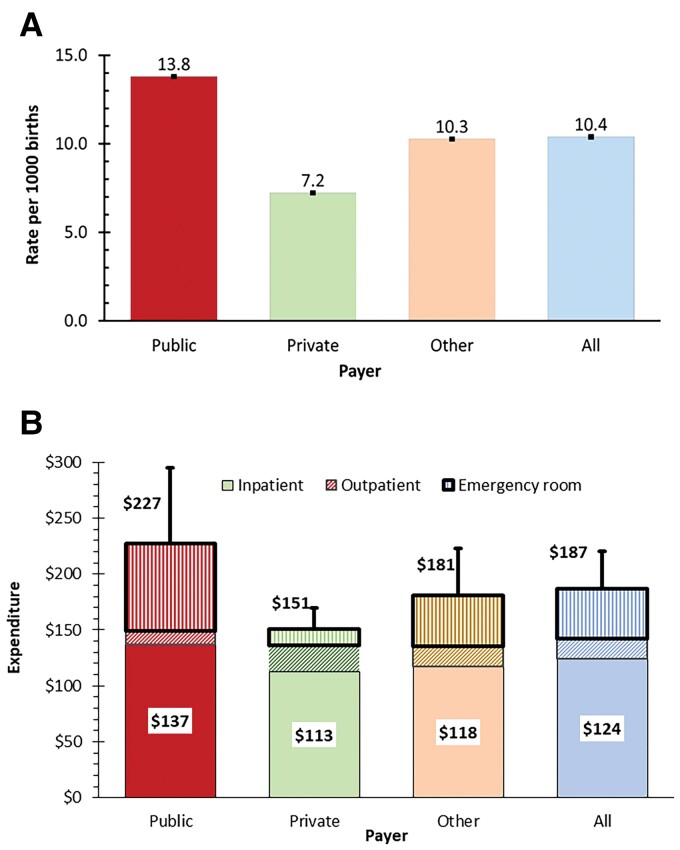
Figure 4.
Breakdowns by payer (with 95% confidence interval) of (A) rates of respiratory syncytial virus (RSV) hospitalization per 1000 births and (B) expenditure on RSV treatment per birth by setting. The number at the top of each stacked bar shows the total for the payer (eg, $227 for public) and the number in the white box shows the inpatient expenditure for the payer (eg, $187 for public). The stacked bars represent the settings: inpatient (bottom, solid pattern of color representing the payer), outpatient (middle, diagonal stripes, also of color representing the payer), and emergency room (top, vertical stripes, also of color representing the payer).

