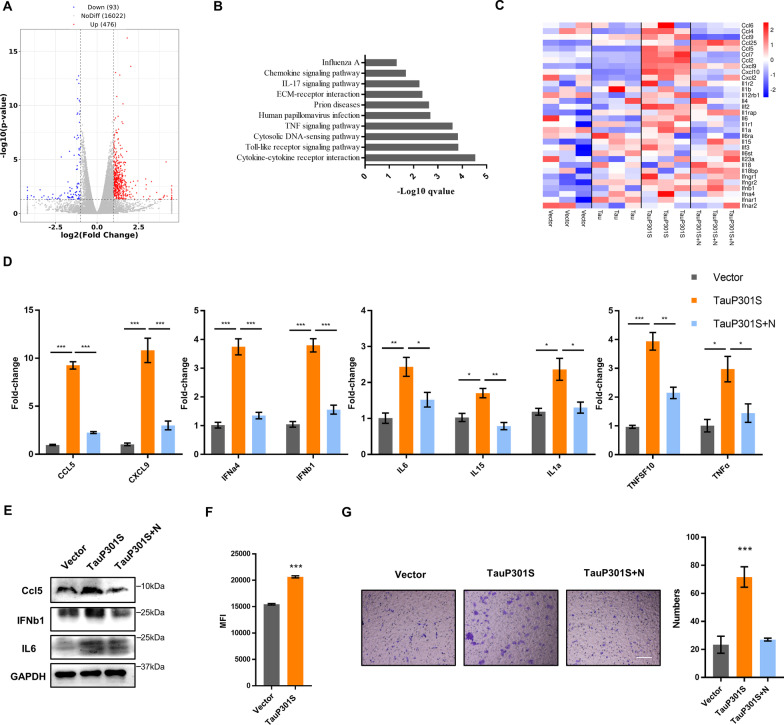
Fig. 2.
Hyperphosphorylated tau induces cytokine upregulation. A Differentially expressed genes (DEGs) between HT22 cells transfected with vector or TauP301S for 48 h. B Analysis of DEGs in the TauP301S and Tau groups according to the Kyoto Encyclopedia of Genes and Genomes (KEGG) database. C Heat map of cytokine genes differentially expressed in HT22 cells transfected with vector or Tau or TauP301S following treatment with DMSO or Nec-1 (30 μM); low expression is shown in blue and high expression in red. D mRNAs from HT22 cells transfected with vector or TauP301S following treatment with DMSO or Nec-1 (30 μM) were extracted and quantified to determine indicated cytokine levels by qPCR. E Cytokine levels in HT22 cells transfected with vector or TauP301S following treatment with DMSO or Nec-1 (30 μM) were analyzed by western blotting with the indicated antibodies. F ROS levels in HT22 cells transfected with vector or TauP301S. G Chemotaxis of pTau-induced cytokines on BV2 cells was analyzed by transwell assays, Scale bars, 100 μm. Data are presented as the mean ± standard error of the mean (SEM) of three experiments, and statistical analysis was performed using one-way ANOVA with Dunnett’s multiple comparisons test in D and two-tailed unpaired t test in F, G

