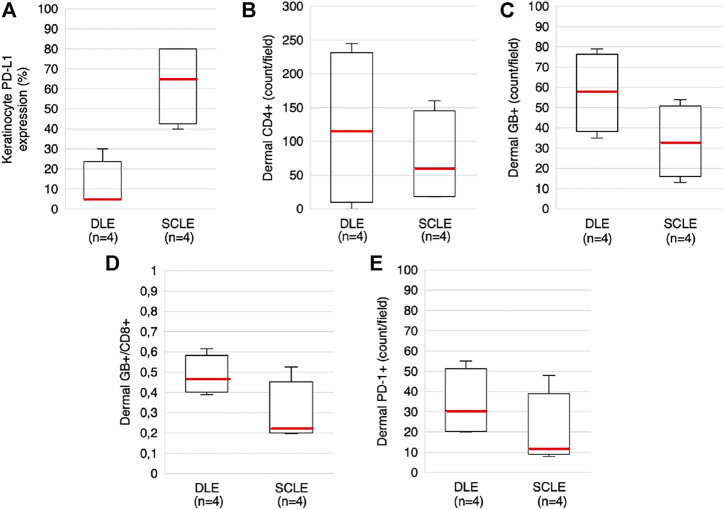
FIGURE 3.
Boxplots presenting KC PD-L1 expression, dermal CD4+, GB+, GB+/CD8+ and PD-1+ cell counts in DLE and SCLE groups (A) KC PD-L1 expression (B) Dermal CD4+ cell count (C) Dermal GB+ cell count (D) Dermal GB+/CD8+ ratio (E) Dermal PD-1 cell count. Red lines representing the median values of each. The median values of these parameters differ between the DLE and the SCLE groups (SCLE, subacute cutaneous lupus erythematosus; DLE, discoid lupus erythematosus; GB, granzyme B; KC, keratinocyte; PD-1, programmed cell death 1; PD-L1, programmed cell death ligand 1).

