Fig. 7.
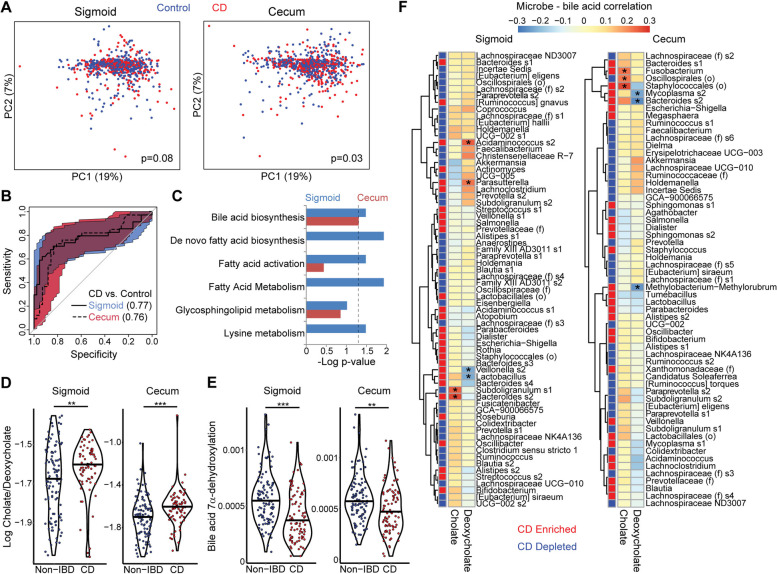
CD is associated with shifts in the metabolome of the cecal and sigmoid MLI. A Metabolomics profiles of cecal and sigmoid MLI samples were visualized by PCoA. p-values calculated by multivariate PERMANOVA adjusting for gender, age, and obesity. B ROC curves for random forests classifiers differentiating CD from controls based on cecal and sigmoid MLI metabolomics features. C Metabolic pathways enriched in differential spectral features were identified by mummichog. The negative log of adjusted p-values is shown for each pathway; the dashed line represents p=0.05. D Log ratios of cholate to deoxycholate are shown for non-IBD controls and CD patients. Significance determined by Wilcoxon rank-sum test. **p<0.01, ***p<0.001. E Relative abundances of the bile acid 7α-dehydroxylation pathway (conversion of cholate to deoxycholate) in the PICRUSt2 predicted metagenome. Significance determined by Wilcoxon rank-sum test. **p<0.01, ***p<0.001. F Heat map and hierarchical clustering showing partial correlations of ASVs enriched or depleted in CD with cholate and deoxycholate, adjusted for disease status, gender, age, and obesity. Red and blue boxes adjacent to the dendogram indicate whether ASVs were enriched or depleted in CD. Significant correlations (q<0.05) are indicated by an asterisk

