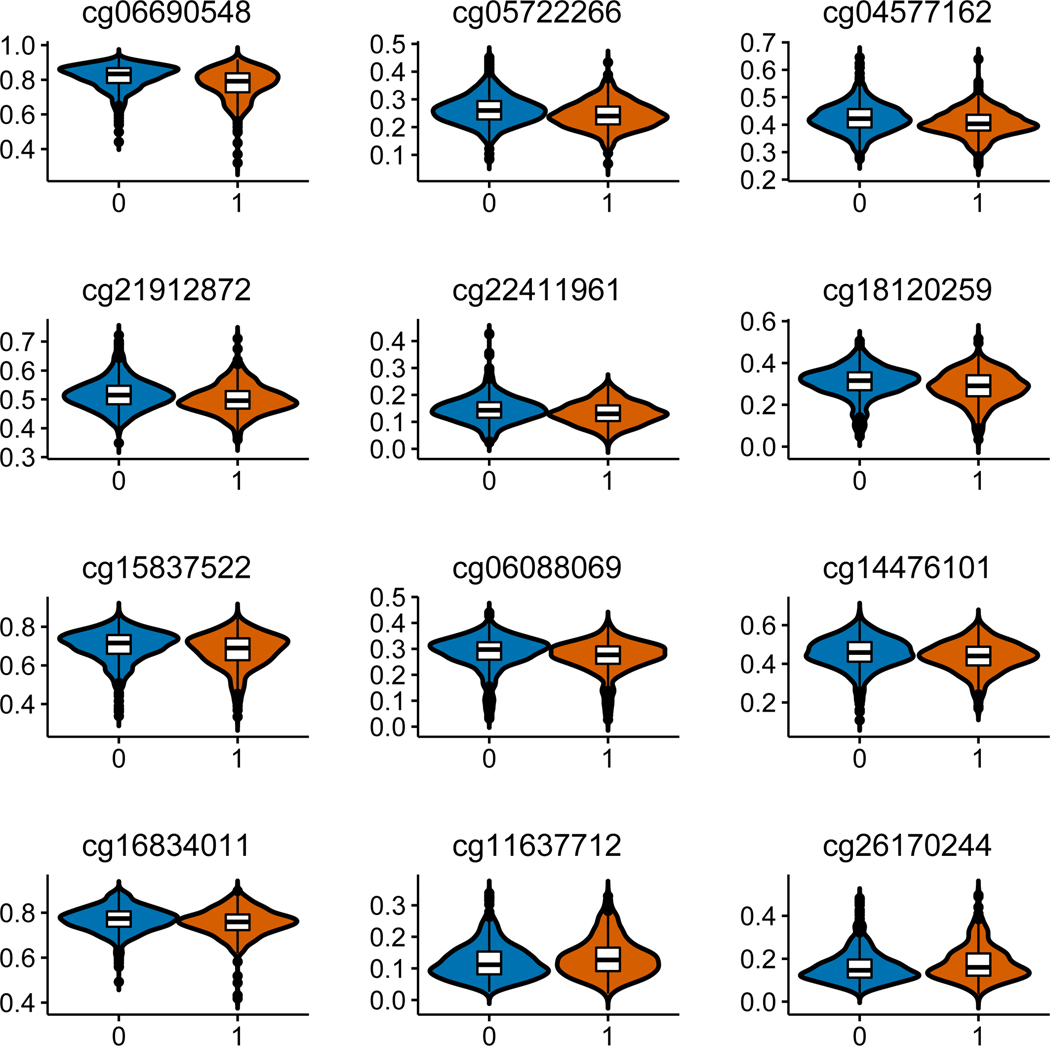
Figure 2.
Significant differential DNA methylation on 12 CpG sites between hazardous alcohol consumption and non-hazardous alcohol consumption. X-axis indicates hazardous alcohol consumption =1 and non-hazardous consumption =0; Y-axis indicates average beta-value of DNA methylation for each group. T-test was used to compare beta value between two groups (p < 0.0007).

