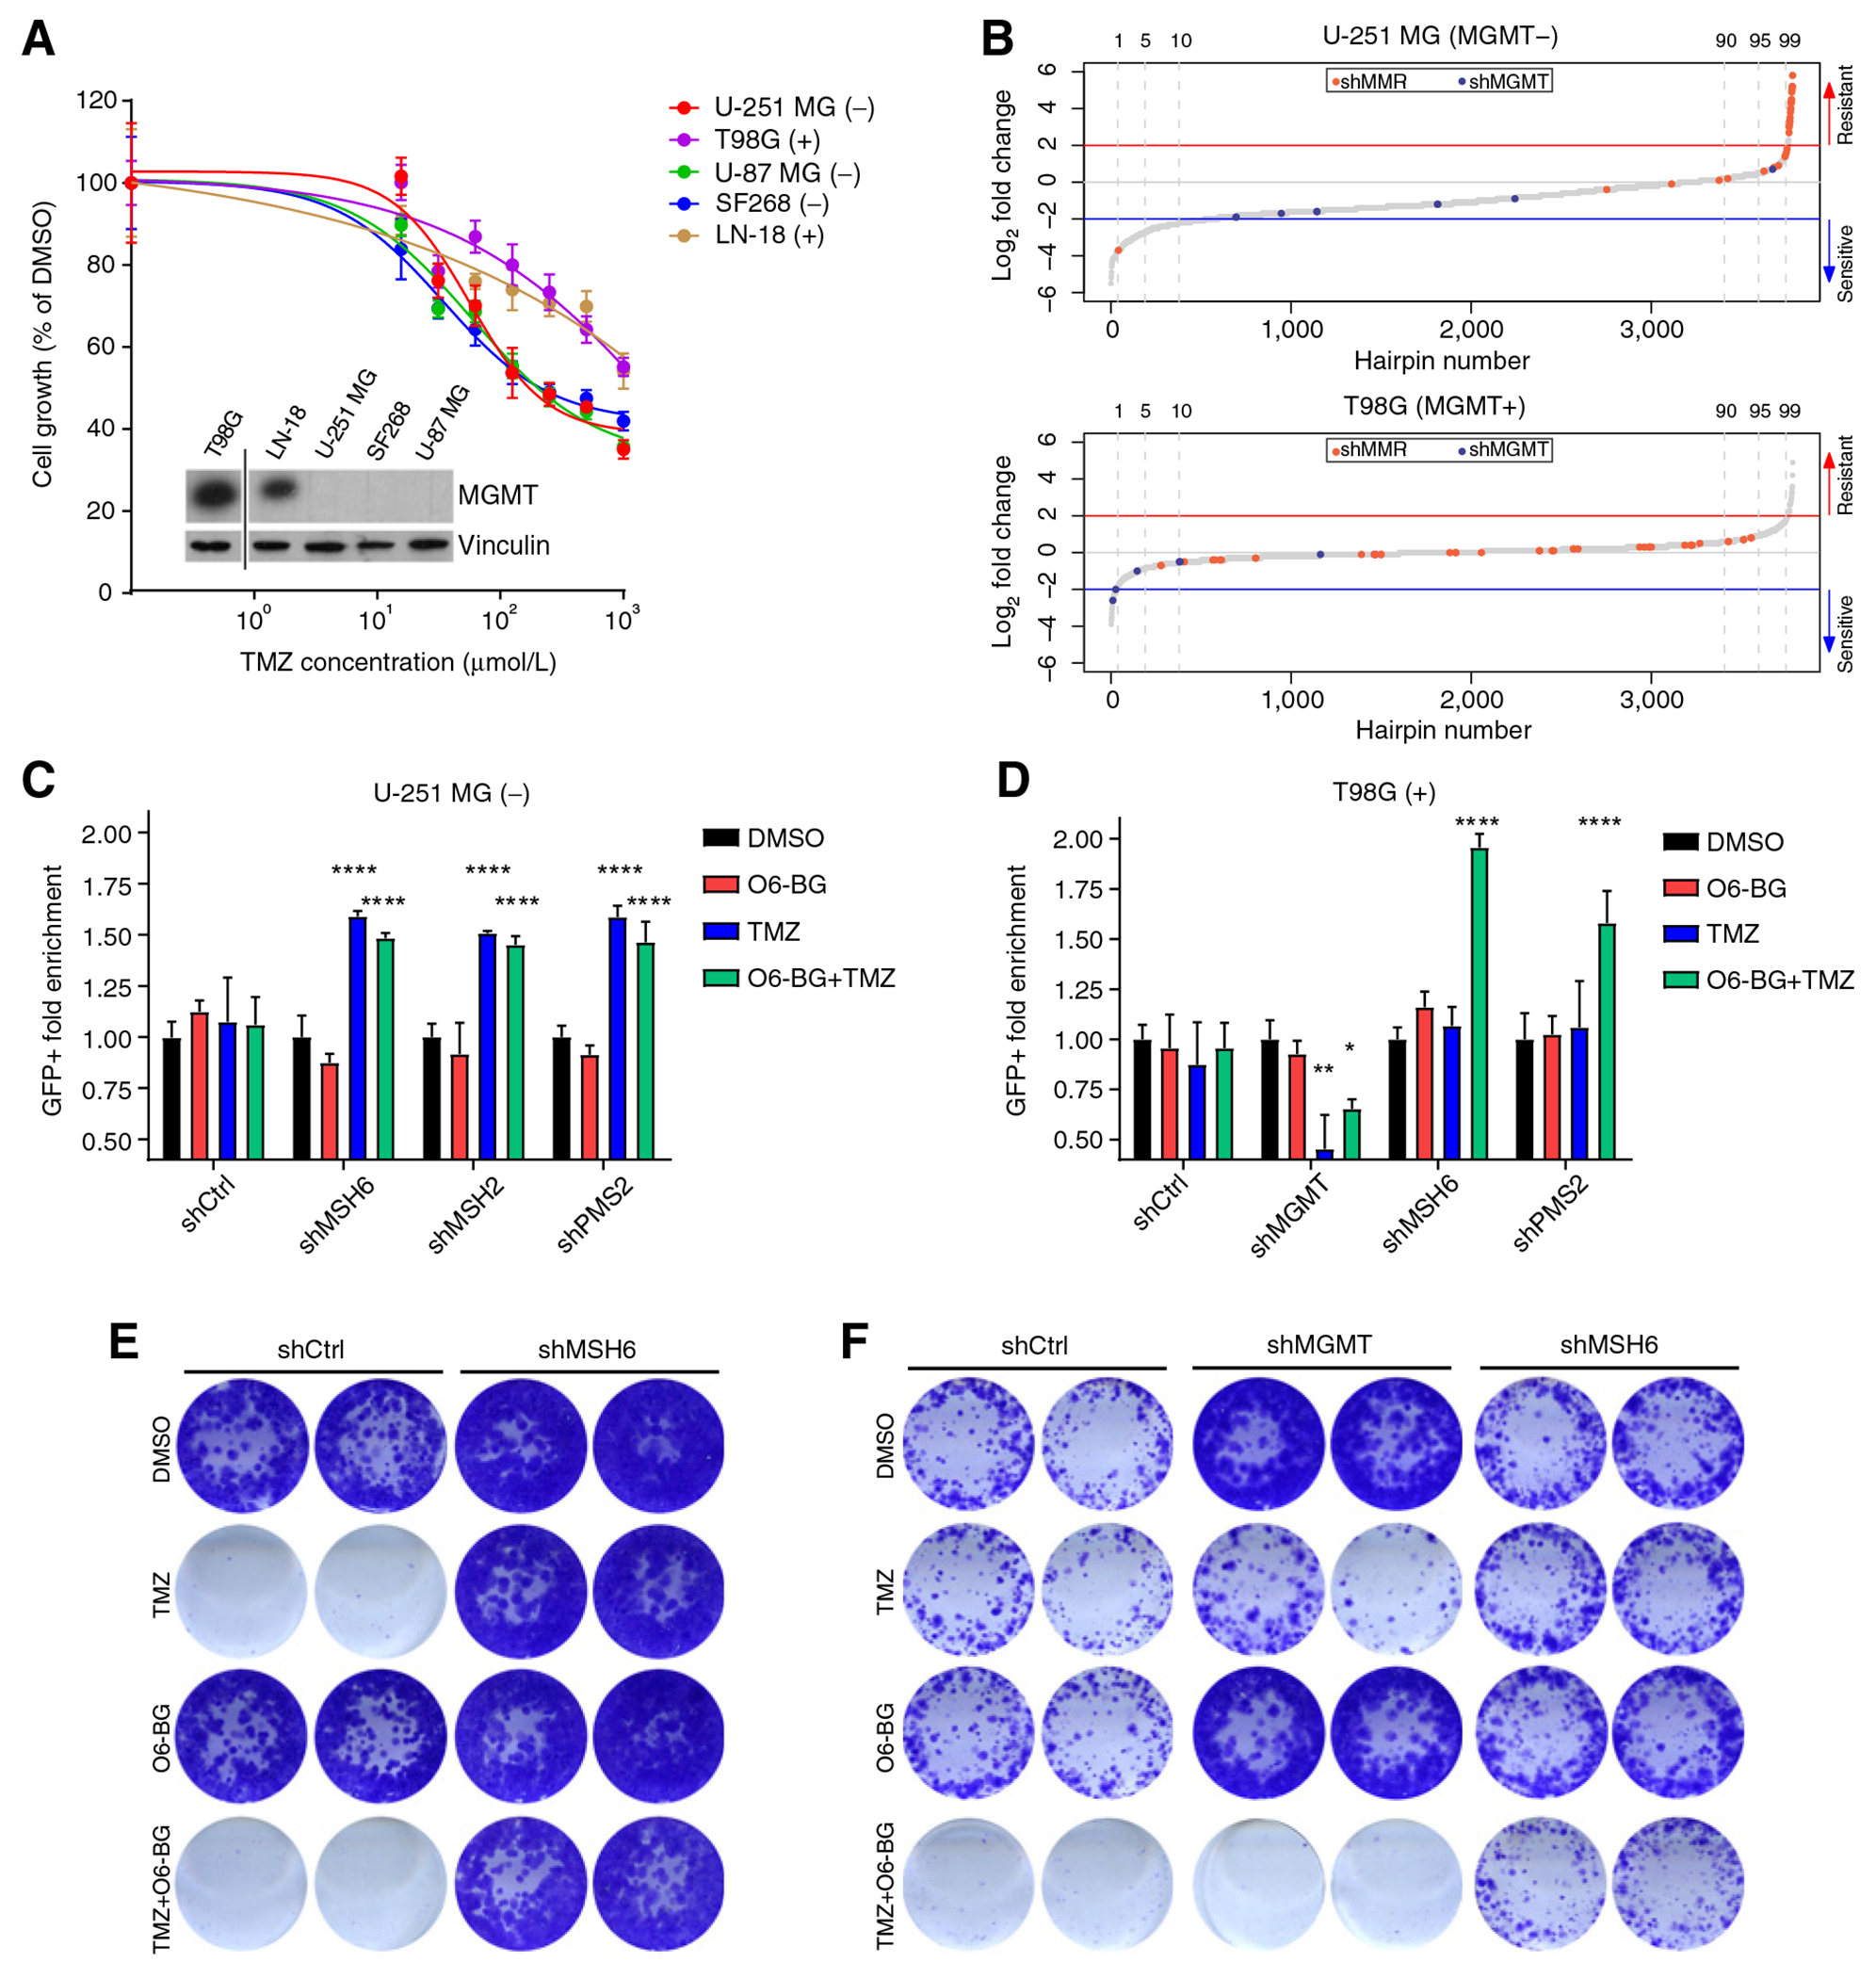
Figure 1.

TMZ cytotoxicity depends on MMR functionality and MGMT expression. A, Viability of parental U-251 MG, T98G, U-87 MG, LN-18, and SF268 cell lines upon exposure to different concentrations of TMZ measured by MTT. Values are represented as percentage of cell viability compared with DMSO control. The inlay is a Western blot analysis of these cell lines showing the expression of MGMT (top) as compared with the loading control (vinculin, bottom). MGMT expression for each cell lines is also indicated in the legend: (−) = MGMT negative and (+) = MGMT positive. B, HiSeq shRNA screening results of U-251 MG and T98G cells transduced with the DDR library and treated with TMZ (U-251 MG 100 μmol/L and T98G 200 μmol/L). shRNAs targeting the components of the MMR machinery and MGMT are highlighted in red and green, respectively. C and D, Competition assay of U-251 MG (C) and T98G (D) cells expressing shRNAs (shRen.660, shMGMT.430, shMSH6.3908, shPMS2.946, and shMSH2.357) targeting different components of the MMR machinery after treatment with TMZ (100 μmol/L) and/or the MGMT inhibitor O6-BG (200 μmol/L). The represented value is the fold enrichment of the shRNA-expressing cells (eGFP+) compared with the control cells (mCherry+) and normalized to the DMSO control. Statistical test: Two-way ANOVA (P values: *, P < 0.05; **, P < 0.01; ***, P < 0.001; ****, P < 0.0001, compared with DMSO treated). E and F, CFA of U-251 MG (E) and T98G (F) cells expressing control shRNA (shRen.660), shMSH6.3908, or shMGMT.430 after treatment with TMZ and/or O6-BG for 9 days.
